4-Diphosphocytidyl-2-C-Methylerythritol Synthetase
(All numbering and residues are taken from first PDB file)
![]()
![]()
Bending Residue Dihedral Analysis
Residue
iResidue
i+1Distance of hinge axis to residue i in
(A) Distance of hinge axis to residue i in
(A) Change in
(deg) Change in
(deg) Angle of psi(i) axis to hinge axis
(deg) Angle of psi(i) axis to hinge axis
(deg) Percentage Progress
ALA-10
VAL-11
6.5
6.4
-1.1
2.9
172.3
171.9
72.6
VAL-11
VAL-12
7.6
7.6
-2.6
5.4
101.4
98.8
153.3
VAL-12
PRO-13
6.9
6.7
-6.4
6.3
162.4
160.3
8.9

Graph shows rotational transition at bending residues and can be used
to identify hinge bending residues.
Probably only informative for interdomain rotations greater than 20 degrees
Residue
iResidue
i+1Distance of hinge axis to residue i in
(A) Distance of hinge axis to residue i in
(A) Change in
(deg) Change in
(deg) Angle of psi(i) axis to hinge axis
(deg) Angle of psi(i) axis to hinge axis
(deg) Percentage Progress
ALA-14
ALA-15
7.8
7.8
0.4
7.0
177.0
177.7
-274.6
LYS-27
GLN-28
14.7
14.2
2.0
-1.9
54.0
49.5
179.4
GLN-28
TYR-29
11.3
11.0
9.3
-8.6
103.9
101.5
99.8
TYR-29
LEU-30
11.4
11.1
5.4
-7.0
82.7
84.3
-8.6
LEU-30
SER-31
15.1
14.8
-1.4
4.9
140.7
147.6
163.8
SER-31
ILE-32
15.8
15.7
1.2
6.6
44.0
44.7
-65.2
ILE-32
GLY-33
17.3
17.2
21.2
0.1
60.9
67.2
241.9
GLY-33
ASN-34
18.5
18.6
-147.8
140.0
66.0
36.4
-236.0
ASN-34
GLN-35
17.3
17.0
16.4
6.2
86.8
89.6
-166.9
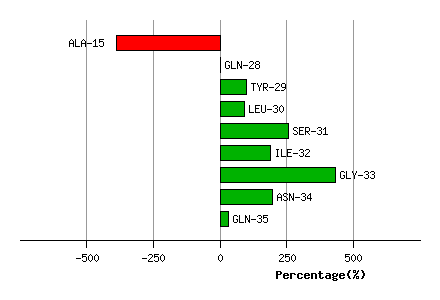
Graph shows rotational transition at bending residues and can be used
to identify hinge bending residues.
Probably only informative for interdomain rotations greater than 20 degrees
Residue
iResidue
i+1Distance of hinge axis to residue i in
(A) Distance of hinge axis to residue i in
(A) Change in
(deg) Change in
(deg) Angle of psi(i) axis to hinge axis
(deg) Angle of psi(i) axis to hinge axis
(deg) Percentage Progress
VAL-54
VAL-55
3.8
3.9
5.6
-3.9
14.5
13.6
76.3
VAL-55
ILE-56
5.4
5.4
0.2
0.6
66.3
68.2
31.4
ILE-56
ALA-57
3.8
3.8
0.7
0.8
25.6
25.2
68.4

Graph shows rotational transition at bending residues and can be used
to identify hinge bending residues.
Probably only informative for interdomain rotations greater than 20 degrees
Residue
iResidue
i+1Distance of hinge axis to residue i in
(A) Distance of hinge axis to residue i in
(A) Change in
(deg) Change in
(deg) Angle of psi(i) axis to hinge axis
(deg) Angle of psi(i) axis to hinge axis
(deg) Percentage Progress
ASP-62
SER-63
4.0
4.0
3.0
1.6
88.1
91.5
24.3
SER-63
ARG-64
4.5
4.5
-6.5
3.4
133.5
136.6
-37.6
ARG-64
PHE-65
6.9
6.7
-2.2
3.4
143.1
141.9
126.7

Graph shows rotational transition at bending residues and can be used
to identify hinge bending residues.
Probably only informative for interdomain rotations greater than 20 degrees
Residue
iResidue
i+1Distance of hinge axis to residue i in
(A) Distance of hinge axis to residue i in
(A) Change in
(deg) Change in
(deg) Angle of psi(i) axis to hinge axis
(deg) Angle of psi(i) axis to hinge axis
(deg) Percentage Progress
ASN-72
HIS-73
9.2
9.2
-3.1
0.6
11.7
13.6
80.5
HIS-73
PRO-74
8.1
8.2
0.1
-0.7
98.9
99.1
0.9
PRO-74
GLN-75
9.8
9.8
3.0
-0.8
111.2
111.1
-68.3
GLN-75
ILE-76
7.1
7.1
-1.3
-2.1
126.0
126.9
-39.7
ILE-76
THR-77
4.8
4.8
2.5
-4.7
34.8
32.0
56.3
THR-77
VAL-78
6.0
6.0
2.3
-2.5
54.5
58.1
-34.0
VAL-78
VAL-79
4.3
4.2
6.8
-0.9
54.2
54.5
104.2
VAL-79
ASP-80
6.6
6.6
4.8
-5.8
56.2
57.1
-32.4
ASP-80
GLY-81
7.2
7.1
4.0
0.5
114.2
114.4
-64.0

Graph shows rotational transition at bending residues and can be used
to identify hinge bending residues.
Probably only informative for interdomain rotations greater than 20 degrees
Residue
iResidue
i+1Distance of hinge axis to residue i in
(A) Distance of hinge axis to residue i in
(A) Change in
(deg) Change in
(deg) Angle of psi(i) axis to hinge axis
(deg) Angle of psi(i) axis to hinge axis
(deg) Percentage Progress
LYS-94
ALA-95
14.5
14.5
-3.5
4.0
101.2
99.4
-102.3
ALA-95
ALA-96
12.0
12.0
-5.8
10.8
166.2
162.6
242.2
ALA-96
GLY-97
11.9
11.8
-6.3
11.2
121.2
120.2
108.0
GLY-97
ASP-98
14.6
14.4
-2.7
-1.6
128.4
129.3
-111.5
ASP-98
ALA-99
16.7
16.6
-5.7
4.5
138.7
142.0
-22.7
ALA-99
GLN-100
13.9
13.9
-0.6
4.6
107.5
109.0
-32.2

Graph shows rotational transition at bending residues and can be used
to identify hinge bending residues.
Probably only informative for interdomain rotations greater than 20 degrees