Glutamate Receptor Subunit 2
(All numbering and residues are taken from first PDB file)
![]()
![]()
Bending Residue Dihedral Analysis
Residue
iResidue
i+1Distance of hinge axis to residue i in
(A) Distance of hinge axis to residue i in
(A) Change in
(deg) Change in
(deg) Angle of psi(i) axis to hinge axis
(deg) Angle of psi(i) axis to hinge axis
(deg) Percentage Progress
LEU-12
GLU-13
12.5
12.7
-4.8
3.1
54.1
56.5
68.2
GLU-13
SER-14
10.8
10.9
-2.3
-0.2
96.9
98.9
-102.1
SER-14
PRO-15
7.9
7.9
0.0
5.6
149.2
145.9
114.1
PRO-15
TYR-16
5.0
4.9
-3.0
-0.3
82.6
79.2
-83.6

Graph shows rotational transition at bending residues and can be used
to identify hinge bending residues.
Probably only informative for interdomain rotations greater than 20 degrees
Residue
iResidue
i+1Distance of hinge axis to residue i in
(A) Distance of hinge axis to residue i in
(A) Change in
(deg) Change in
(deg) Angle of psi(i) axis to hinge axis
(deg) Angle of psi(i) axis to hinge axis
(deg) Percentage Progress
PRO-105
PHE-106
8.8
8.8
-2.2
3.2
130.2
130.7
-19.0
PHE-106
MET-107
7.8
7.7
2.7
-4.3
84.5
86.2
64.9
MET-107
SER-108
4.3
4.2
-1.3
-6.7
38.5
37.6
265.4

Graph shows rotational transition at bending residues and can be used
to identify hinge bending residues.
Probably only informative for interdomain rotations greater than 20 degrees
Residue
iResidue
i+1Distance of hinge axis to residue i in
(A) Distance of hinge axis to residue i in
(A) Change in
(deg) Change in
(deg) Angle of psi(i) axis to hinge axis
(deg) Angle of psi(i) axis to hinge axis
(deg) Percentage Progress
TYR-135
GLY-136
24.5
24.4
-1.4
4.3
95.1
94.3
-58.2
GLY-136
THR-137
23.1
23.0
4.1
-3.8
100.5
97.3
-26.7
THR-137
LEU-138
20.3
20.2
-0.3
-0.2
43.4
42.4
19.8

Graph shows rotational transition at bending residues and can be used
to identify hinge bending residues.
Probably only informative for interdomain rotations greater than 20 degrees
Residue
iResidue
i+1Distance of hinge axis to residue i in
(A) Distance of hinge axis to residue i in
(A) Change in
(deg) Change in
(deg) Angle of psi(i) axis to hinge axis
(deg) Angle of psi(i) axis to hinge axis
(deg) Percentage Progress
ASP-139
SER-140
22.3
21.6
19.6
-13.0
91.6
92.0
-116.7
SER-140
GLY-141
21.9
21.7
-2.5
0.4
76.5
74.0
-268.6
GLY-141
SER-142
18.4
18.2
-14.4
10.5
8.7
11.2
152.3

Graph shows rotational transition at bending residues and can be used
to identify hinge bending residues.
Probably only informative for interdomain rotations greater than 20 degrees
Residue
iResidue
i+1Distance of hinge axis to residue i in
(A) Distance of hinge axis to residue i in
(A) Change in
(deg) Change in
(deg) Angle of psi(i) axis to hinge axis
(deg) Angle of psi(i) axis to hinge axis
(deg) Percentage Progress
VAL-169
PHE-170
26.8
26.8
5.4
-5.1
99.2
98.7
1.6
PHE-170
VAL-171
24.7
24.6
-0.1
-3.8
9.2
11.6
170.7
VAL-171
ARG-172
22.9
22.8
-25.7
11.8
77.4
80.5
191.3
ARG-172
THR-173
22.3
22.3
15.2
0.7
95.8
109.8
-364.4
THR-173
THR-174
18.6
18.9
-15.6
2.4
108.8
105.6
-142.0

Graph shows rotational transition at bending residues and can be used
to identify hinge bending residues.
Probably only informative for interdomain rotations greater than 20 degrees
Residue
iResidue
i+1Distance of hinge axis to residue i in
(A) Distance of hinge axis to residue i in
(A) Change in
(deg) Change in
(deg) Angle of psi(i) axis to hinge axis
(deg) Angle of psi(i) axis to hinge axis
(deg) Percentage Progress
LEU-192
GLU-193
14.2
14.2
0.3
2.4
66.4
66.2
6.9
GLU-193
SER-194
10.5
10.5
-5.4
-0.9
70.9
72.4
310.5
SER-194
THR-195
8.6
8.6
-5.6
-5.1
34.0
36.5
624.6
THR-195
MET-196
6.1
5.9
16.2
2.1
148.0
147.6
-895.4
MET-196
ASN-197
8.8
8.6
-10.7
7.6
86.6
87.9
29.8

Graph shows rotational transition at bending residues and can be used
to identify hinge bending residues.
Probably only informative for interdomain rotations greater than 20 degrees
Residue
iResidue
i+1Distance of hinge axis to residue i in
(A) Distance of hinge axis to residue i in
(A) Change in
(deg) Change in
(deg) Angle of psi(i) axis to hinge axis
(deg) Angle of psi(i) axis to hinge axis
(deg) Percentage Progress
ASP-216
SER-217
9.4
9.7
8.5
-8.3
116.0
115.3
-16.5
SER-217
LYS-218
6.1
6.6
14.7
-13.4
100.9
103.0
60.5
LYS-218
GLY-219
7.3
7.7
-6.5
6.4
43.7
47.0
88.4
GLY-219
TYR-220
7.1
7.3
0.9
-5.9
130.9
135.5
119.5

Graph shows rotational transition at bending residues and can be used
to identify hinge bending residues.
Probably only informative for interdomain rotations greater than 20 degrees
Residue
iResidue
i+1Distance of hinge axis to residue i in
(A) Distance of hinge axis to residue i in
(A) Change in
(deg) Change in
(deg) Angle of psi(i) axis to hinge axis
(deg) Angle of psi(i) axis to hinge axis
(deg) Percentage Progress
LEU-246
LEU-247
10.7
10.7
2.9
-4.9
95.5
92.2
19.0
LEU-247
ASP-248
7.4
7.3
9.9
-6.1
88.2
89.2
90.1
ASP-248
LYS-249
7.0
7.0
-0.6
2.2
157.9
159.0
140.6

Graph shows rotational transition at bending residues and can be used
to identify hinge bending residues.
Probably only informative for interdomain rotations greater than 20 degrees
Residue
iResidue
i+1Distance of hinge axis to residue i in
(A) Distance of hinge axis to residue i in
(A) Change in
(deg) Change in
(deg) Angle of psi(i) axis to hinge axis
(deg) Angle of psi(i) axis to hinge axis
(deg) Percentage Progress
LYS-253
TRP-254
5.2
5.3
-2.8
3.6
71.2
72.6
-31.3
TRP-254
TRP-255
2.0
2.1
0.4
1.8
68.0
67.6
26.8
TRP-255
TYR-256
4.5
4.6
-1.7
-3.2
75.7
74.9
76.3

Graph shows rotational transition at bending residues and can be used
to identify hinge bending residues.
Probably only informative for interdomain rotations greater than 20 degrees
Residue
iResidue
i+1Distance of hinge axis to residue i in
(A) Distance of hinge axis to residue i in
(A) Change in
(deg) Change in
(deg) Angle of psi(i) axis to hinge axis
(deg) Angle of psi(i) axis to hinge axis
(deg) Percentage Progress
ASP-257
LYS-258
8.4
8.4
-12.2
5.1
136.9
138.5
-325.0
LYS-258
GLY-259
6.9
6.7
4.8
-5.7
104.0
102.9
16.3
GLY-259
GLU-260
9.7
9.4
20.4
-11.7
46.3
46.8
281.3
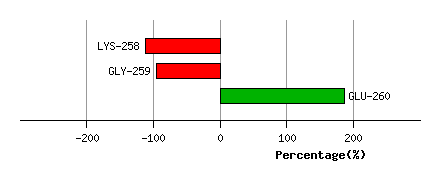
Graph shows rotational transition at bending residues and can be used
to identify hinge bending residues.
Probably only informative for interdomain rotations greater than 20 degrees