Udp-Galactose 4-Epimerase
(All numbering and residues are taken from first PDB file)
![]()
![]()
Bending Residue Dihedral Analysis
Residue
iResidue
i+1Distance of hinge axis to residue i in
(A) Distance of hinge axis to residue i in
(A) Change in
(deg) Change in
(deg) Angle of psi(i) axis to hinge axis
(deg) Angle of psi(i) axis to hinge axis
(deg) Percentage Progress
PHE-129
SER-130
11.1
11.2
-4.6
0.1
91.9
91.6
34.7
SER-130
SER-131
9.0
8.9
6.9
-9.2
148.0
145.0
28.5
SER-131
SER-132
8.2
8.0
-7.7
6.9
95.3
95.7
34.5
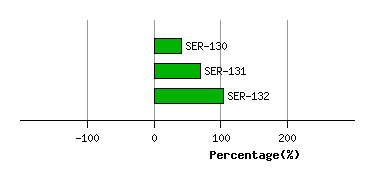
Graph shows rotational transition at bending residues and can be used
to identify hinge bending residues.
Probably only informative for interdomain rotations greater than 20 degrees
Residue
iResidue
i+1Distance of hinge axis to residue i in
(A) Distance of hinge axis to residue i in
(A) Change in
(deg) Change in
(deg) Angle of psi(i) axis to hinge axis
(deg) Angle of psi(i) axis to hinge axis
(deg) Percentage Progress
ALA-147
HIS-148
2.1
2.2
-4.7
9.4
109.4
109.1
95.5
HIS-148
PRO-149
1.7
1.6
-7.5
7.4
95.9
95.6
-2.8
PRO-149
THR-150
4.6
4.6
-2.7
-0.8
37.3
35.9
41.8

Graph shows rotational transition at bending residues and can be used
to identify hinge bending residues.
Probably only informative for interdomain rotations greater than 20 degrees
Residue
iResidue
i+1Distance of hinge axis to residue i in
(A) Distance of hinge axis to residue i in
(A) Change in
(deg) Change in
(deg) Angle of psi(i) axis to hinge axis
(deg) Angle of psi(i) axis to hinge axis
(deg) Percentage Progress
ARG-184
TYR-185
3.9
3.8
4.1
1.4
52.5
52.2
47.1
TYR-185
PHE-186
3.3
3.2
-3.6
-0.6
69.2
67.3
-8.6
PHE-186
ASN-187
5.2
5.1
3.6
4.3
42.3
44.3
62.3

Graph shows rotational transition at bending residues and can be used
to identify hinge bending residues.
Probably only informative for interdomain rotations greater than 20 degrees
Residue
iResidue
i+1Distance of hinge axis to residue i in
(A) Distance of hinge axis to residue i in
(A) Change in
(deg) Change in
(deg) Angle of psi(i) axis to hinge axis
(deg) Angle of psi(i) axis to hinge axis
(deg) Percentage Progress
THR-189
GLY-190
8.4
8.1
-5.9
-2.1
40.6
39.8
159.5
GLY-190
ALA-191
8.2
8.0
-1.0
5.1
51.2
51.0
-21.2
ALA-191
HIS-192
5.9
5.7
2.6
-2.5
116.9
116.0
-34.7
HIS-192
ALA-193
3.3
3.1
3.3
-5.2
54.9
54.4
-64.0
HIS-192
ALA-193
3.3
3.1
3.3
-5.2
54.9
54.4
-64.0

Graph shows rotational transition at bending residues and can be used
to identify hinge bending residues.
Probably only informative for interdomain rotations greater than 20 degrees
Residue
iResidue
i+1Distance of hinge axis to residue i in
(A) Distance of hinge axis to residue i in
(A) Change in
(deg) Change in
(deg) Angle of psi(i) axis to hinge axis
(deg) Angle of psi(i) axis to hinge axis
(deg) Percentage Progress
HIS-192
ALA-193
3.3
3.1
3.3
-5.2
54.9
54.4
-64.0
HIS-192
ALA-193
3.3
3.1
3.3
-5.2
54.9
54.4
-64.0
ALA-193
SER-194
6.0
6.0
6.8
-5.0
19.1
16.6
75.2
SER-194
GLY-195
4.6
4.6
2.5
5.2
82.8
81.9
-4.7
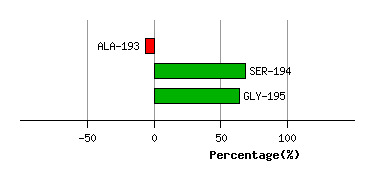
Graph shows rotational transition at bending residues and can be used
to identify hinge bending residues.
Probably only informative for interdomain rotations greater than 20 degrees
Residue
iResidue
i+1Distance of hinge axis to residue i in
(A) Distance of hinge axis to residue i in
(A) Change in
(deg) Change in
(deg) Angle of psi(i) axis to hinge axis
(deg) Angle of psi(i) axis to hinge axis
(deg) Percentage Progress
ILE-242
HIS-243
6.4
6.3
-3.4
4.0
18.0
19.2
-5.9
HIS-243
VAL-244
5.8
5.7
-1.7
-1.5
84.3
83.6
9.4
VAL-244
VAL-245
3.0
2.8
0.5
-1.6
111.0
111.6
-12.8

Graph shows rotational transition at bending residues and can be used
to identify hinge bending residues.
Probably only informative for interdomain rotations greater than 20 degrees
Residue
iResidue
i+1Distance of hinge axis to residue i in
(A) Distance of hinge axis to residue i in
(A) Change in
(deg) Change in
(deg) Angle of psi(i) axis to hinge axis
(deg) Angle of psi(i) axis to hinge axis
(deg) Percentage Progress
ASN-268
LEU-269
1.4
1.6
-1.5
3.1
154.4
155.0
42.5
LEU-269
GLY-270
1.4
1.6
-3.5
1.2
98.2
97.0
-42.6
GLY-270
THR-271
4.4
4.3
-1.9
6.8
100.7
99.4
81.1

Graph shows rotational transition at bending residues and can be used
to identify hinge bending residues.
Probably only informative for interdomain rotations greater than 20 degrees
Residue
iResidue
i+1Distance of hinge axis to residue i in
(A) Distance of hinge axis to residue i in
(A) Change in
(deg) Change in
(deg) Angle of psi(i) axis to hinge axis
(deg) Angle of psi(i) axis to hinge axis
(deg) Percentage Progress
TRP-320
THR-321
9.8
10.1
1.3
2.6
69.7
71.6
22.0
THR-321
ALA-322
9.2
9.4
2.6
1.9
140.6
137.1
22.1
ALA-322
ALA-323
7.7
7.9
-14.1
-1.0
69.9
64.2
-8.9
ALA-323
LEU-324
10.5
10.5
41.3
-39.6
105.7
119.1
-132.8

Graph shows rotational transition at bending residues and can be used
to identify hinge bending residues.
Probably only informative for interdomain rotations greater than 20 degrees
Residue
iResidue
i+1Distance of hinge axis to residue i in
(A) Distance of hinge axis to residue i in
(A) Change in
(deg) Change in
(deg) Angle of psi(i) axis to hinge axis
(deg) Angle of psi(i) axis to hinge axis
(deg) Percentage Progress
SER-342
GLY-343
17.7
17.4
16.1
-3.8
64.7
69.5
123.3
GLY-343
PHE-344
14.6
14.3
-7.2
-8.7
45.9
44.5
53.3
PHE-344
GLY-345
13.6
13.2
177.9
32.0
134.5
123.8
1699.8

Graph shows rotational transition at bending residues and can be used
to identify hinge bending residues.
Probably only informative for interdomain rotations greater than 20 degrees