Dihydrodipicolinate Synthase
(All numbering and residues are taken from first PDB file)
![]()
![]()
Bending Residue Dihedral Analysis
Residue
iResidue
i+1Distance of hinge axis to residue i in
(A) Distance of hinge axis to residue i in
(A) Change in
(deg) Change in
(deg) Angle of psi(i) axis to hinge axis
(deg) Angle of psi(i) axis to hinge axis
(deg) Percentage Progress
ILE-14
THR-15
9.1
9.1
0.0
-1.9
124.2
124.4
69.9
THR-15
PRO-16
10.4
10.4
-4.0
3.3
131.5
130.9
-89.9
PRO-16
PHE-17
10.2
10.1
1.2
0.1
103.5
102.7
-55.9
PHE-17
LYS-18
13.7
13.7
-0.9
-0.8
117.9
116.8
35.8
LYS-18
ASN-19
15.4
15.4
-1.9
2.3
81.2
80.4
46.2

Graph shows rotational transition at bending residues and can be used
to identify hinge bending residues.
Probably only informative for interdomain rotations greater than 20 degrees
Residue
iResidue
i+1Distance of hinge axis to residue i in
(A) Distance of hinge axis to residue i in
(A) Change in
(deg) Change in
(deg) Angle of psi(i) axis to hinge axis
(deg) Angle of psi(i) axis to hinge axis
(deg) Percentage Progress
ASP-23
GLU-24
12.3
12.2
-2.6
5.0
47.2
45.1
152.9
GLU-24
GLN-25
10.7
10.7
-0.9
6.3
96.2
96.2
53.6
GLN-25
SER-26
9.8
9.8
-11.9
8.2
129.1
124.9
-235.1

Graph shows rotational transition at bending residues and can be used
to identify hinge bending residues.
Probably only informative for interdomain rotations greater than 20 degrees
Residue
iResidue
i+1Distance of hinge axis to residue i in
(A) Distance of hinge axis to residue i in
(A) Change in
(deg) Change in
(deg) Angle of psi(i) axis to hinge axis
(deg) Angle of psi(i) axis to hinge axis
(deg) Percentage Progress
ARG-29
LEU-30
4.5
4.5
-4.2
2.9
64.8
65.1
142.0
LEU-30
ILE-31
1.7
1.6
3.2
-3.4
49.9
48.4
124.8
ILE-31
LYS-32
0.9
0.9
1.0
4.4
79.4
78.6
-152.2

Graph shows rotational transition at bending residues and can be used
to identify hinge bending residues.
Probably only informative for interdomain rotations greater than 20 degrees
Residue
iResidue
i+1Distance of hinge axis to residue i in
(A) Distance of hinge axis to residue i in
(A) Change in
(deg) Change in
(deg) Angle of psi(i) axis to hinge axis
(deg) Angle of psi(i) axis to hinge axis
(deg) Percentage Progress
ILE-39
ASP-40
9.9
9.9
-3.3
2.6
9.3
9.2
34.3
ASP-40
ALA-41
11.3
11.4
-0.1
-0.7
60.8
60.8
81.2
ALA-41
VAL-42
9.8
9.7
0.5
3.5
45.0
46.2
73.3

Graph shows rotational transition at bending residues and can be used
to identify hinge bending residues.
Probably only informative for interdomain rotations greater than 20 degrees
Residue
iResidue
i+1Distance of hinge axis to residue i in
(A) Distance of hinge axis to residue i in
(A) Change in
(deg) Change in
(deg) Angle of psi(i) axis to hinge axis
(deg) Angle of psi(i) axis to hinge axis
(deg) Percentage Progress
THR-47
THR-48
17.0
17.1
-2.3
5.5
51.7
52.1
10.5
THR-48
GLY-49
13.7
13.8
-0.4
3.3
105.5
106.8
59.6
GLY-49
GLU-50
12.8
12.9
-1.5
-2.5
86.9
85.9
-22.0
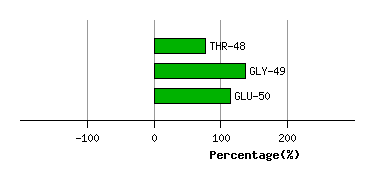
Graph shows rotational transition at bending residues and can be used
to identify hinge bending residues.
Probably only informative for interdomain rotations greater than 20 degrees
Residue
iResidue
i+1Distance of hinge axis to residue i in
(A) Distance of hinge axis to residue i in
(A) Change in
(deg) Change in
(deg) Angle of psi(i) axis to hinge axis
(deg) Angle of psi(i) axis to hinge axis
(deg) Percentage Progress
THR-53
LEU-54
20.9
20.9
2.2
-5.2
129.5
128.1
62.8
LEU-54
THR-55
18.9
18.9
-1.3
0.3
40.9
40.1
-17.7
THR-55
HIS-56
20.8
20.8
-7.4
9.5
37.1
38.5
242.8

Graph shows rotational transition at bending residues and can be used
to identify hinge bending residues.
Probably only informative for interdomain rotations greater than 20 degrees
Residue
iResidue
i+1Distance of hinge axis to residue i in
(A) Distance of hinge axis to residue i in
(A) Change in
(deg) Change in
(deg) Angle of psi(i) axis to hinge axis
(deg) Angle of psi(i) axis to hinge axis
(deg) Percentage Progress
LYS-76
VAL-77
8.6
8.5
3.4
-2.0
121.7
121.5
-9.8
VAL-77
LEU-78
8.4
8.5
0.1
0.3
81.1
80.3
180.4
LEU-78
ALA-79
12.1
12.1
-1.8
2.6
67.4
66.6
-124.7
ALA-79
GLY-80
12.8
12.7
-4.1
-0.3
67.6
67.4
237.7
GLY-80
ALA-81
15.7
15.6
-5.4
-8.2
132.8
130.4
-928.1
ALA-81
GLY-82
18.6
18.3
63.0
-66.1
96.9
92.9
204.7

Graph shows rotational transition at bending residues and can be used
to identify hinge bending residues.
Probably only informative for interdomain rotations greater than 20 degrees