Penicillin-Binding Protein 2A
(All numbering and residues are taken from first PDB file)
![]()
![]()
Bending Residue Dihedral Analysis
Residue
iResidue
i+1Distance of hinge axis to residue i in
(A) Distance of hinge axis to residue i in
(A) Change in
(deg) Change in
(deg) Angle of psi(i) axis to hinge axis
(deg) Angle of psi(i) axis to hinge axis
(deg) Percentage Progress
ILE-69
TYR-70
10.1
10.0
-2.4
1.9
31.3
31.2
2.4
TYR-70
ASN-71
10.9
10.8
-9.1
5.6
95.3
93.5
-9.4
ASN-71
SER-72
13.1
13.3
-1.3
3.8
111.5
113.7
27.3

Graph shows rotational transition at bending residues and can be used
to identify hinge bending residues.
Probably only informative for interdomain rotations greater than 20 degrees
Residue
iResidue
i+1Distance of hinge axis to residue i in
(A) Distance of hinge axis to residue i in
(A) Change in
(deg) Change in
(deg) Angle of psi(i) axis to hinge axis
(deg) Angle of psi(i) axis to hinge axis
(deg) Percentage Progress
LEU-73
GLY-74
8.3
8.7
0.6
-6.4
37.7
36.5
-55.9
GLY-74
VAL-75
11.2
11.5
13.3
-10.0
34.0
34.6
19.2
VAL-75
LYS-76
9.9
9.8
11.7
6.5
41.1
39.6
180.4
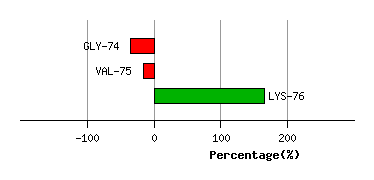
Graph shows rotational transition at bending residues and can be used
to identify hinge bending residues.
Probably only informative for interdomain rotations greater than 20 degrees
Residue
iResidue
i+1Distance of hinge axis to residue i in
(A) Distance of hinge axis to residue i in
(A) Change in
(deg) Change in
(deg) Angle of psi(i) axis to hinge axis
(deg) Angle of psi(i) axis to hinge axis
(deg) Percentage Progress
SER-141
ILE-142
5.2
5.2
-3.1
6.2
53.5
54.4
6.3
ILE-142
HIS-143
3.2
3.3
-11.3
9.9
117.3
120.7
1.2
HIS-143
ILE-144
2.8
2.7
-4.2
2.0
46.7
47.0
14.9

Graph shows rotational transition at bending residues and can be used
to identify hinge bending residues.
Probably only informative for interdomain rotations greater than 20 degrees
Residue
iResidue
i+1Distance of hinge axis to residue i in
(A) Distance of hinge axis to residue i in
(A) Change in
(deg) Change in
(deg) Angle of psi(i) axis to hinge axis
(deg) Angle of psi(i) axis to hinge axis
(deg) Percentage Progress
ARG-298
VAL-299
7.3
7.4
-11.5
13.4
76.9
82.1
-45.5
VAL-299
THR-300
3.7
3.8
-3.3
10.4
82.0
81.3
-28.6
THR-300
ILE-301
2.1
2.2
-10.9
6.8
66.7
75.7
105.5

Graph shows rotational transition at bending residues and can be used
to identify hinge bending residues.
Probably only informative for interdomain rotations greater than 20 degrees
Residue
iResidue
i+1Distance of hinge axis to residue i in
(A) Distance of hinge axis to residue i in
(A) Change in
(deg) Change in
(deg) Angle of psi(i) axis to hinge axis
(deg) Angle of psi(i) axis to hinge axis
(deg) Percentage Progress
HIS-311
THR-312
6.8
6.8
-5.9
6.2
85.9
87.5
58.8
THR-312
LEU-313
5.6
5.7
4.6
-8.1
153.3
154.5
15.4
LEU-313
ILE-314
2.8
3.0
7.1
-5.4
124.2
123.2
-5.8

Graph shows rotational transition at bending residues and can be used
to identify hinge bending residues.
Probably only informative for interdomain rotations greater than 20 degrees