Glutamate Receptor Subunit 2
(All numbering and residues are taken from first PDB file)
![]()
![]()
Bending Residue Dihedral Analysis
Residue
iResidue
i+1Distance of hinge axis to residue i in
(A) Distance of hinge axis to residue i in
(A) Change in
(deg) Change in
(deg) Angle of psi(i) axis to hinge axis
(deg) Angle of psi(i) axis to hinge axis
(deg) Percentage Progress
SER-108
LEU-109
7.2
6.8
8.9
-7.9
105.6
102.9
46.1
LEU-109
GLY-110
4.0
3.6
-10.2
9.3
4.2
3.9
32.5
GLY-110
ILE-111
2.4
2.1
1.0
0.1
98.5
98.3
16.2

Graph shows rotational transition at bending residues and can be used
to identify hinge bending residues.
Probably only informative for interdomain rotations greater than 20 degrees
Residue
iResidue
i+1Distance of hinge axis to residue i in
(A) Distance of hinge axis to residue i in
(A) Change in
(deg) Change in
(deg) Angle of psi(i) axis to hinge axis
(deg) Angle of psi(i) axis to hinge axis
(deg) Percentage Progress
GLU-193
SER-194
3.7
3.6
-7.3
0.3
54.9
55.5
109.2
SER-194
THR-195
1.8
1.8
-2.3
-10.5
6.6
3.3
211.8
THR-195
MET-196
1.4
1.0
18.9
-1.5
110.1
109.9
-209.3
MET-196
ASN-197
5.2
4.8
-3.1
1.8
80.4
80.4
33.7
MET-196
ASN-197
5.2
4.8
-3.1
1.8
80.4
80.4
33.7

Graph shows rotational transition at bending residues and can be used
to identify hinge bending residues.
Probably only informative for interdomain rotations greater than 20 degrees
Residue
iResidue
i+1Distance of hinge axis to residue i in
(A) Distance of hinge axis to residue i in
(A) Change in
(deg) Change in
(deg) Angle of psi(i) axis to hinge axis
(deg) Angle of psi(i) axis to hinge axis
(deg) Percentage Progress
MET-196
ASN-197
5.2
4.8
-3.1
1.8
80.4
80.4
33.7
MET-196
ASN-197
5.2
4.8
-3.1
1.8
80.4
80.4
33.7
ASN-197
GLU-198
6.2
6.1
4.3
0.5
45.5
43.6
38.8
GLU-198
TYR-199
5.6
5.6
-5.7
2.1
151.8
150.6
-41.3

Graph shows rotational transition at bending residues and can be used
to identify hinge bending residues.
Probably only informative for interdomain rotations greater than 20 degrees
Residue
iResidue
i+1Distance of hinge axis to residue i in
(A) Distance of hinge axis to residue i in
(A) Change in
(deg) Change in
(deg) Angle of psi(i) axis to hinge axis
(deg) Angle of psi(i) axis to hinge axis
(deg) Percentage Progress
ASN-214
LEU-215
3.5
3.7
9.3
-4.2
21.8
22.9
72.2
LEU-215
ASP-216
1.5
1.6
2.6
1.4
84.1
86.6
-12.8
ASP-216
SER-217
4.1
3.8
-1.7
-2.5
25.3
27.6
69.6

Graph shows rotational transition at bending residues and can be used
to identify hinge bending residues.
Probably only informative for interdomain rotations greater than 20 degrees
Residue
iResidue
i+1Distance of hinge axis to residue i in
(A) Distance of hinge axis to residue i in
(A) Change in
(deg) Change in
(deg) Angle of psi(i) axis to hinge axis
(deg) Angle of psi(i) axis to hinge axis
(deg) Percentage Progress
LYS-253
TRP-254
1.6
1.6
2.8
-4.3
110.9
111.7
48.1
TRP-254
TRP-255
2.3
2.0
5.4
-4.0
135.9
134.6
3.1
TRP-255
TYR-256
3.7
3.5
7.2
-13.0
73.2
71.8
-37.9
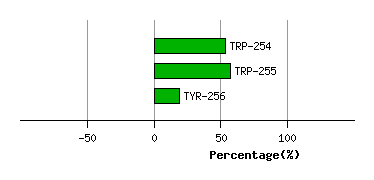
Graph shows rotational transition at bending residues and can be used
to identify hinge bending residues.
Probably only informative for interdomain rotations greater than 20 degrees