Putative Sugar Kinase
(All numbering and residues are taken from first PDB file)
![]()
![]()
Bending Residue Dihedral Analysis
Residue
iResidue
i+1Distance of hinge axis to residue i in
(A) Distance of hinge axis to residue i in
(A) Change in
(deg) Change in
(deg) Angle of psi(i) axis to hinge axis
(deg) Angle of psi(i) axis to hinge axis
(deg) Percentage Progress
SER-14
VAL-15
1.8
2.3
-14.2
-2.4
54.2
54.8
65.7
VAL-15
ASP-16
2.6
3.1
-12.9
25.7
99.5
102.2
-11.5
ASP-16
LEU-17
4.3
4.2
-2.2
8.9
73.7
79.0
-14.0

Graph shows rotational transition at bending residues and can be used
to identify hinge bending residues.
Probably only informative for interdomain rotations greater than 20 degrees
Residue
iResidue
i+1Distance of hinge axis to residue i in
(A) Distance of hinge axis to residue i in
(A) Change in
(deg) Change in
(deg) Angle of psi(i) axis to hinge axis
(deg) Angle of psi(i) axis to hinge axis
(deg) Percentage Progress
LYS-27
CYS-28
7.9
7.8
22.4
-6.7
49.4
47.5
58.9
CYS-28
PRO-29
4.4
4.7
-20.1
-1.0
61.3
75.7
55.8
PRO-29
GLY-30
1.7
1.9
-9.3
3.8
78.3
77.3
24.8
GLY-30
GLY-31
1.8
1.6
-4.5
-1.3
60.0
62.3
12.0

Graph shows rotational transition at bending residues and can be used
to identify hinge bending residues.
Probably only informative for interdomain rotations greater than 20 degrees
Residue
iResidue
i+1Distance of hinge axis to residue i in
(A) Distance of hinge axis to residue i in
(A) Change in
(deg) Change in
(deg) Angle of psi(i) axis to hinge axis
(deg) Angle of psi(i) axis to hinge axis
(deg) Percentage Progress
SER-84
ALA-85
5.3
6.3
0.7
-5.4
88.0
80.3
8.6
ALA-85
VAL-86
1.5
2.6
9.5
-8.0
128.3
125.3
12.7
VAL-86
LEU-87
2.7
3.4
4.1
4.4
75.6
76.3
5.7
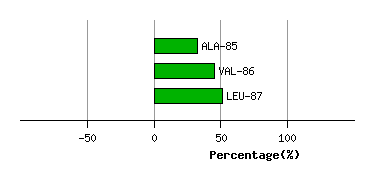
Graph shows rotational transition at bending residues and can be used
to identify hinge bending residues.
Probably only informative for interdomain rotations greater than 20 degrees
Residue
iResidue
i+1Distance of hinge axis to residue i in
(A) Distance of hinge axis to residue i in
(A) Change in
(deg) Change in
(deg) Angle of psi(i) axis to hinge axis
(deg) Angle of psi(i) axis to hinge axis
(deg) Percentage Progress
TYR-101
LEU-102
5.7
5.4
33.0
-33.7
133.9
130.2
-18.6
LEU-102
VAL-103
4.5
4.3
-8.4
-5.3
54.9
61.9
20.5
VAL-103
HIS-104
1.1
1.7
-8.9
-33.1
60.7
73.6
102.0

Graph shows rotational transition at bending residues and can be used
to identify hinge bending residues.
Probably only informative for interdomain rotations greater than 20 degrees