Nadp-Dependent Alcohol Dehydrogenase
(All numbering and residues are taken from first PDB file)
![]()
![]()
Bending Residue Dihedral Analysis
Residue
iResidue
i+1Distance of hinge axis to residue i in
(A) Distance of hinge axis to residue i in
(A) Change in
(deg) Change in
(deg) Angle of psi(i) axis to hinge axis
(deg) Angle of psi(i) axis to hinge axis
(deg) Percentage Progress
PRO-1077
GLY-1078
12.0
12.1
-5.9
11.1
52.9
56.9
-110.3
GLY-1078
ASP-1079
12.2
12.2
-2.6
0.4
49.0
47.7
-24.7
ASP-1079
ARG-1080
8.8
8.9
4.5
-9.7
147.1
144.7
185.4

Graph shows rotational transition at bending residues and can be used
to identify hinge bending residues.
Probably only informative for interdomain rotations greater than 20 degrees
Residue
iResidue
i+1Distance of hinge axis to residue i in
(A) Distance of hinge axis to residue i in
(A) Change in
(deg) Change in
(deg) Angle of psi(i) axis to hinge axis
(deg) Angle of psi(i) axis to hinge axis
(deg) Percentage Progress
ILE-1082
VAL-1083
8.5
8.3
2.3
-2.9
121.9
120.3
-21.6
VAL-1083
PRO-1084
11.8
11.6
2.4
-1.3
55.2
55.8
36.0
PRO-1084
CYS-1085
13.2
13.0
1.8
-4.5
94.8
95.2
65.3

Graph shows rotational transition at bending residues and can be used
to identify hinge bending residues.
Probably only informative for interdomain rotations greater than 20 degrees
Residue
iResidue
i+1Distance of hinge axis to residue i in
(A) Distance of hinge axis to residue i in
(A) Change in
(deg) Change in
(deg) Angle of psi(i) axis to hinge axis
(deg) Angle of psi(i) axis to hinge axis
(deg) Percentage Progress
PRO-1088
ASP-1089
19.0
19.3
6.0
9.6
8.7
15.0
486.2
ASP-1089
TRP-1090
19.9
19.7
13.2
-9.9
83.6
86.4
-70.2
TRP-1090
ARG-1091
18.6
18.4
17.8
-13.3
42.0
42.1
152.9

Graph shows rotational transition at bending residues and can be used
to identify hinge bending residues.
Probably only informative for interdomain rotations greater than 20 degrees
Residue
iResidue
i+1Distance of hinge axis to residue i in
(A) Distance of hinge axis to residue i in
(A) Change in
(deg) Change in
(deg) Angle of psi(i) axis to hinge axis
(deg) Angle of psi(i) axis to hinge axis
(deg) Percentage Progress
GLN-1101
HIS-1102
22.5
22.6
-3.6
1.0
66.4
67.4
-10.4
HIS-1102
SER-1103
25.7
25.9
2.9
-9.0
178.6
179.7
189.9
SER-1103
ASN-1104
24.4
24.6
-0.9
4.2
69.4
67.9
-71.8

Graph shows rotational transition at bending residues and can be used
to identify hinge bending residues.
Probably only informative for interdomain rotations greater than 20 degrees
Residue
iResidue
i+1Distance of hinge axis to residue i in
(A) Distance of hinge axis to residue i in
(A) Change in
(deg) Change in
(deg) Angle of psi(i) axis to hinge axis
(deg) Angle of psi(i) axis to hinge axis
(deg) Percentage Progress
GLY-1105
MET-1106
29.3
29.4
7.9
-12.2
163.3
162.5
133.4
MET-1106
LEU-1107
29.7
29.8
-5.9
3.1
71.5
68.8
-31.9
LEU-1107
ALA-1108
26.7
26.8
7.4
3.7
45.3
47.3
239.2

Graph shows rotational transition at bending residues and can be used
to identify hinge bending residues.
Probably only informative for interdomain rotations greater than 20 degrees
Residue
iResidue
i+1Distance of hinge axis to residue i in
(A) Distance of hinge axis to residue i in
(A) Change in
(deg) Change in
(deg) Angle of psi(i) axis to hinge axis
(deg) Angle of psi(i) axis to hinge axis
(deg) Percentage Progress
GLY-1109
TRP-1110
22.3
22.2
11.0
1.1
60.1
59.8
202.6
TRP-1110
LYS-1111
22.1
22.5
-2.3
-2.1
65.5
58.7
101.3
LYS-1111
PHE-1112
23.0
22.9
-0.5
1.7
118.0
113.7
-56.0
PHE-1112
SER-1113
22.2
22.3
15.6
-24.9
38.4
50.0
-165.3
SER-1113
ASN-1114
25.2
25.5
40.4
-41.1
87.0
87.0
115.4
ASN-1114
PHE-1115
26.8
27.4
-10.5
15.9
46.3
30.6
-42.4
PHE-1115
LYS-1116
28.3
28.1
22.8
-33.6
128.5
124.6
-0.1
LYS-1116
ASP-1117
25.7
25.7
5.1
-9.9
56.5
46.0
-88.9
ASP-1117
GLY-1118
25.5
25.7
9.2
3.6
62.1
58.6
169.3

Graph shows rotational transition at bending residues and can be used
to identify hinge bending residues.
Probably only informative for interdomain rotations greater than 20 degrees
Residue
iResidue
i+1Distance of hinge axis to residue i in
(A) Distance of hinge axis to residue i in
(A) Change in
(deg) Change in
(deg) Angle of psi(i) axis to hinge axis
(deg) Angle of psi(i) axis to hinge axis
(deg) Percentage Progress
ALA-1134
ILE-1135
5.6
5.4
2.0
-2.2
102.3
103.7
-14.1
ILE-1135
LEU-1136
3.6
3.3
-1.3
-4.2
9.6
11.8
158.6
LEU-1136
PRO-1137
4.9
4.7
-4.3
1.0
79.8
78.4
-44.2

Graph shows rotational transition at bending residues and can be used
to identify hinge bending residues.
Probably only informative for interdomain rotations greater than 20 degrees
Residue
iResidue
i+1Distance of hinge axis to residue i in
(A) Distance of hinge axis to residue i in
(A) Change in
(deg) Change in
(deg) Angle of psi(i) axis to hinge axis
(deg) Angle of psi(i) axis to hinge axis
(deg) Percentage Progress
PRO-1141
LEU-1142
8.3
8.3
-1.3
4.5
63.6
65.7
8.8
LEU-1142
GLU-1143
10.3
10.3
2.1
5.5
56.2
54.5
138.2
GLU-1143
ASN-1144
11.2
10.9
-16.7
6.5
97.3
92.4
-130.5

Graph shows rotational transition at bending residues and can be used
to identify hinge bending residues.
Probably only informative for interdomain rotations greater than 20 degrees
Residue
iResidue
i+1Distance of hinge axis to residue i in
(A) Distance of hinge axis to residue i in
(A) Change in
(deg) Change in
(deg) Angle of psi(i) axis to hinge axis
(deg) Angle of psi(i) axis to hinge axis
(deg) Percentage Progress
VAL-1146
MET-1147
11.3
11.1
1.9
1.1
118.2
118.9
-36.2
MET-1147
ILE-1148
10.9
10.8
0.6
-0.9
61.4
62.4
-26.7
ILE-1148
THR-1149
9.7
9.5
-1.8
7.2
126.0
126.1
85.0

Graph shows rotational transition at bending residues and can be used
to identify hinge bending residues.
Probably only informative for interdomain rotations greater than 20 degrees
Residue
iResidue
i+1Distance of hinge axis to residue i in
(A) Distance of hinge axis to residue i in
(A) Change in
(deg) Change in
(deg) Angle of psi(i) axis to hinge axis
(deg) Angle of psi(i) axis to hinge axis
(deg) Percentage Progress
VAL-1197
GLY-1198
21.5
21.5
10.0
-1.3
100.1
104.3
-104.4
GLY-1198
SER-1199
20.7
21.1
17.5
-5.9
28.7
30.6
266.7
SER-1199
ARG-1200
20.3
20.9
-9.2
-7.6
83.3
90.4
13.9
ARG-1200
PRO-1201
19.1
19.4
5.4
-7.1
76.9
78.6
-59.0
PRO-1201
ILE-1202
16.0
16.1
8.7
5.2
131.7
134.6
-258.6
ILE-1202
CYS-1203
14.1
14.5
-2.5
-2.7
56.2
55.7
116.0

Graph shows rotational transition at bending residues and can be used
to identify hinge bending residues.
Probably only informative for interdomain rotations greater than 20 degrees
Residue
iResidue
i+1Distance of hinge axis to residue i in
(A) Distance of hinge axis to residue i in
(A) Change in
(deg) Change in
(deg) Angle of psi(i) axis to hinge axis
(deg) Angle of psi(i) axis to hinge axis
(deg) Percentage Progress
LYS-1288
THR-1289
35.5
35.8
7.3
-7.0
146.3
144.0
49.1
THR-1289
ILE-1290
33.8
34.0
-1.2
3.2
96.0
94.8
-63.2
ILE-1290
LYS-1291
32.4
32.5
4.5
-12.2
150.9
149.8
163.9
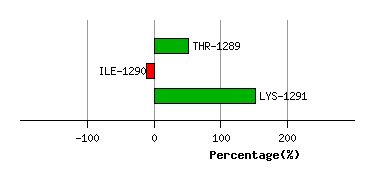
Graph shows rotational transition at bending residues and can be used
to identify hinge bending residues.
Probably only informative for interdomain rotations greater than 20 degrees
Residue
iResidue
i+1Distance of hinge axis to residue i in
(A) Distance of hinge axis to residue i in
(A) Change in
(deg) Change in
(deg) Angle of psi(i) axis to hinge axis
(deg) Angle of psi(i) axis to hinge axis
(deg) Percentage Progress
ARG-1306
ASP-1307
4.5
4.4
-0.2
4.9
72.0
70.8
-61.6
ASP-1307
MET-1308
5.0
5.4
-5.4
4.1
20.4
16.1
52.5
MET-1308
VAL-1309
6.7
6.8
-3.9
3.6
52.4
55.2
-7.1

Graph shows rotational transition at bending residues and can be used
to identify hinge bending residues.
Probably only informative for interdomain rotations greater than 20 degrees
Residue
iResidue
i+1Distance of hinge axis to residue i in
(A) Distance of hinge axis to residue i in
(A) Change in
(deg) Change in
(deg) Angle of psi(i) axis to hinge axis
(deg) Angle of psi(i) axis to hinge axis
(deg) Percentage Progress
SER-1317
LYS-1318
6.7
6.5
-1.5
5.4
142.8
139.9
73.8
LYS-1318
LEU-1319
7.9
7.8
-4.4
0.0
78.4
78.3
8.1
LEU-1319
VAL-1320
11.0
11.0
3.9
-2.3
95.7
97.2
-10.7

Graph shows rotational transition at bending residues and can be used
to identify hinge bending residues.
Probably only informative for interdomain rotations greater than 20 degrees