D-Glucose 6-Phosphotransferase
(All numbering and residues are taken from first PDB file)
![]()
![]()
Bending Residue Dihedral Analysis
Residue
iResidue
i+1Distance of hinge axis to residue i in
(A) Distance of hinge axis to residue i in
(A) Change in
(deg) Change in
(deg) Angle of psi(i) axis to hinge axis
(deg) Angle of psi(i) axis to hinge axis
(deg) Percentage Progress
ARG-517
ARG-518
9.1
8.8
-1.4
5.4
144.1
141.4
-11.1
ARG-518
THR-519
10.2
10.2
13.9
5.9
38.1
37.1
70.3
THR-519
PRO-520
9.7
9.7
14.8
-5.7
47.8
56.6
103.8
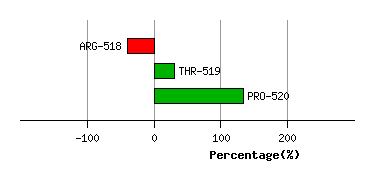
Graph shows rotational transition at bending residues and can be used
to identify hinge bending residues.
Probably only informative for interdomain rotations greater than 20 degrees
Residue
iResidue
i+1Distance of hinge axis to residue i in
(A) Distance of hinge axis to residue i in
(A) Change in
(deg) Change in
(deg) Angle of psi(i) axis to hinge axis
(deg) Angle of psi(i) axis to hinge axis
(deg) Percentage Progress
GLN-607
GLN-608
7.4
6.5
-4.7
-16.9
79.8
76.6
39.9
GLN-608
THR-609
3.9
3.1
7.8
12.5
41.5
54.2
88.9
THR-609
SER-610
1.5
0.9
-6.2
12.8
66.3
49.6
-12.5
SER-610
LEU-611
2.0
2.4
15.7
-5.5
165.3
149.7
-49.4
LEU-611
ASP-612
2.1
2.0
3.5
4.3
105.2
96.0
-9.8

Graph shows rotational transition at bending residues and can be used
to identify hinge bending residues.
Probably only informative for interdomain rotations greater than 20 degrees
Residue
iResidue
i+1Distance of hinge axis to residue i in
(A) Distance of hinge axis to residue i in
(A) Change in
(deg) Change in
(deg) Angle of psi(i) axis to hinge axis
(deg) Angle of psi(i) axis to hinge axis
(deg) Percentage Progress
ALA-653
VAL-654
4.2
4.5
-7.6
-8.5
89.7
90.0
-15.1
VAL-654
VAL-655
4.8
5.4
-2.7
-8.7
76.4
85.2
32.5
VAL-655
ASN-656
4.7
5.2
-5.2
27.0
94.6
90.5
68.0

Graph shows rotational transition at bending residues and can be used
to identify hinge bending residues.
Probably only informative for interdomain rotations greater than 20 degrees
Residue
iResidue
i+1Distance of hinge axis to residue i in
(A) Distance of hinge axis to residue i in
(A) Change in
(deg) Change in
(deg) Angle of psi(i) axis to hinge axis
(deg) Angle of psi(i) axis to hinge axis
(deg) Percentage Progress
LEU-891
LEU-892
16.9
16.5
-9.3
-4.8
78.5
80.0
68.7
LEU-892
SER-893
15.9
15.7
10.0
54.5
85.3
76.7
67.2
SER-893
GLU-894
12.2
12.2
16.5
16.3
102.0
39.0
-24.4
GLU-894
ASP-895
11.2
11.4
154.8
-143.5
103.0
107.1
-139.4
ASP-895
GLY-896
9.2
8.7
-57.0
161.3
44.6
32.2
-669.9
GLY-896
SER-897
7.9
10.2
-166.1
18.2
57.6
53.1
536.0
SER-897
GLY-898
8.2
8.1
11.1
52.1
66.6
81.6
209.4
GLY-898
LYS-899
6.6
6.0
21.5
-6.3
79.1
77.8
56.1
LYS-899
GLY-900
3.7
3.0
-5.3
-4.4
37.9
32.5
53.9

Graph shows rotational transition at bending residues and can be used
to identify hinge bending residues.
Probably only informative for interdomain rotations greater than 20 degrees