Glycerol Kinase
(All numbering and residues are taken from first PDB file)
![]()
![]()
Bending Residue Dihedral Analysis
Residue
iResidue
i+1Distance of hinge axis to residue i in
(A) Distance of hinge axis to residue i in
(A) Change in
(deg) Change in
(deg) Angle of psi(i) axis to hinge axis
(deg) Angle of psi(i) axis to hinge axis
(deg) Percentage Progress
ALA-262
LYS-263
5.0
5.4
1.7
-23.7
148.8
153.3
74.4
LYS-263
ASN-264
2.8
2.9
33.7
-12.4
75.9
72.4
53.6
ASN-264
THR-265
1.1
1.4
6.5
-2.9
139.8
140.2
-8.0
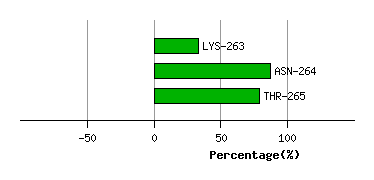
Graph shows rotational transition at bending residues and can be used
to identify hinge bending residues.
Probably only informative for interdomain rotations greater than 20 degrees
Residue
iResidue
i+1Distance of hinge axis to residue i in
(A) Distance of hinge axis to residue i in
(A) Change in
(deg) Change in
(deg) Angle of psi(i) axis to hinge axis
(deg) Angle of psi(i) axis to hinge axis
(deg) Percentage Progress
ASN-270
PHE-271
7.8
7.7
-21.3
-2.7
42.4
38.5
85.5
PHE-271
LEU-272
5.9
5.8
-15.9
23.2
96.5
96.5
9.1
LEU-272
LEU-273
2.2
2.2
7.2
-13.3
129.1
131.9
17.3

Graph shows rotational transition at bending residues and can be used
to identify hinge bending residues.
Probably only informative for interdomain rotations greater than 20 degrees
Residue
iResidue
i+1Distance of hinge axis to residue i in
(A) Distance of hinge axis to residue i in
(A) Change in
(deg) Change in
(deg) Angle of psi(i) axis to hinge axis
(deg) Angle of psi(i) axis to hinge axis
(deg) Percentage Progress
LEU-304
GLU-305
4.0
4.2
6.1
-15.3
137.7
133.8
40.4
GLU-305
GLY-306
4.0
3.9
10.8
-1.0
72.8
76.7
16.6
GLY-306
SER-307
4.2
4.5
-24.1
4.7
41.6
43.8
64.1

Graph shows rotational transition at bending residues and can be used
to identify hinge bending residues.
Probably only informative for interdomain rotations greater than 20 degrees
Residue
iResidue
i+1Distance of hinge axis to residue i in
(A) Distance of hinge axis to residue i in
(A) Change in
(deg) Change in
(deg) Angle of psi(i) axis to hinge axis
(deg) Angle of psi(i) axis to hinge axis
(deg) Percentage Progress
PHE-346
VAL-347
20.8
21.7
-4.7
1.8
35.1
46.8
4.4
VAL-347
PRO-348
19.8
19.9
22.7
-23.0
82.9
80.2
4.0
PRO-348
ALA-349
18.2
18.7
-96.9
-30.3
31.6
43.0
409.8
ALA-349
PHE-350
18.8
19.1
-81.2
-130.7
109.7
85.4
62.2
ALA-349
PHE-350
18.8
19.1
-81.2
-130.7
109.7
85.4
62.2

Graph shows rotational transition at bending residues and can be used
to identify hinge bending residues.
Probably only informative for interdomain rotations greater than 20 degrees
Residue
iResidue
i+1Distance of hinge axis to residue i in
(A) Distance of hinge axis to residue i in
(A) Change in
(deg) Change in
(deg) Angle of psi(i) axis to hinge axis
(deg) Angle of psi(i) axis to hinge axis
(deg) Percentage Progress
ALA-349
PHE-350
18.8
19.1
-81.2
-130.7
109.7
85.4
62.2
ALA-349
PHE-350
18.8
19.1
-81.2
-130.7
109.7
85.4
62.2
PHE-350
SER-351
16.1
21.2
-40.4
-64.1
83.0
127.0
-140.7
SER-351
GLY-352
14.7
20.4
79.3
148.3
28.4
40.4
769.3
GLY-352
LEU-353
15.0
18.8
118.8
-34.7
63.3
116.0
-108.2
LEU-353
PHE-354
11.4
15.8
-13.8
-171.4
152.6
93.7
-456.0
PHE-354
ALA-355
10.6
12.8
-13.3
120.8
121.2
80.9
206.6
ALA-355
PRO-356
13.3
9.7
80.0
-9.6
106.7
39.2
-212.7
PRO-356
TYR-357
15.3
8.7
12.7
10.8
60.1
44.8
87.5
TYR-357
TRP-358
14.7
12.1
4.3
-26.6
101.6
58.5
-8.2
TRP-358
ARG-359
12.0
12.8
-145.7
175.5
86.4
101.7
-7.1
ARG-359
PRO-360
14.8
16.5
0.2
-10.9
153.6
136.8
58.2
PRO-360
ASP-361
15.5
18.9
-147.5
33.8
91.8
80.6
42.0
ASP-361
ALA-362
19.2
21.8
-160.3
-2.9
17.5
49.9
641.7
ALA-362
ARG-363
21.2
21.4
149.9
-23.2
114.2
148.2
-320.0
ARG-363
GLY-364
23.2
23.2
43.0
53.4
107.8
128.2
-226.5
GLY-364
ALA-365
22.3
22.9
-28.5
2.2
77.4
89.7
19.1
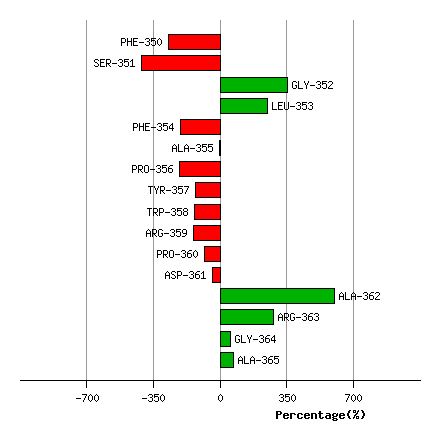
Graph shows rotational transition at bending residues and can be used
to identify hinge bending residues.
Probably only informative for interdomain rotations greater than 20 degrees
Residue
iResidue
i+1Distance of hinge axis to residue i in
(A) Distance of hinge axis to residue i in
(A) Change in
(deg) Change in
(deg) Angle of psi(i) axis to hinge axis
(deg) Angle of psi(i) axis to hinge axis
(deg) Percentage Progress
PRO-435
LYS-436
5.2
3.8
3.2
-11.1
22.2
34.1
-15.4
LYS-436
VAL-437
5.7
3.6
9.4
3.3
87.9
92.9
56.1
VAL-437
ALA-438
7.0
6.1
-11.3
-13.1
44.5
29.6
83.0

Graph shows rotational transition at bending residues and can be used
to identify hinge bending residues.
Probably only informative for interdomain rotations greater than 20 degrees
Residue
iResidue
i+1Distance of hinge axis to residue i in
(A) Distance of hinge axis to residue i in
(A) Change in
(deg) Change in
(deg) Angle of psi(i) axis to hinge axis
(deg) Angle of psi(i) axis to hinge axis
(deg) Percentage Progress
TRP-466
ALA-467
13.2
10.3
-21.7
-19.3
55.0
58.6
123.3
ALA-467
GLU-468
10.9
9.1
-24.0
35.9
106.3
93.3
-34.1
GLU-468
ASP-469
8.2
7.1
-37.3
1.6
36.4
28.8
142.4

Graph shows rotational transition at bending residues and can be used
to identify hinge bending residues.
Probably only informative for interdomain rotations greater than 20 degrees
Residue
iResidue
i+1Distance of hinge axis to residue i in
(A) Distance of hinge axis to residue i in
(A) Change in
(deg) Change in
(deg) Angle of psi(i) axis to hinge axis
(deg) Angle of psi(i) axis to hinge axis
(deg) Percentage Progress
GLU-497
TRP-498
23.8
22.6
90.0
-16.9
80.2
76.3
59.9
TRP-498
VAL-499
26.8
25.8
-10.9
-7.6
84.3
68.1
18.7
VAL-499
ASP-500
25.1
26.7
173.1
-17.1
159.0
174.8
-608.0

Graph shows rotational transition at bending residues and can be used
to identify hinge bending residues.
Probably only informative for interdomain rotations greater than 20 degrees