Utp-Glucose-1-Phosphate Uridylyltransferase 2, Putative
(All numbering and residues are taken from first PDB file)
![]()
![]()
Bending Residue Dihedral Analysis
Residue
iResidue
i+1Distance of hinge axis to residue i in
(A) Distance of hinge axis to residue i in
(A) Change in
(deg) Change in
(deg) Angle of psi(i) axis to hinge axis
(deg) Angle of psi(i) axis to hinge axis
(deg) Percentage Progress
LYS-41
GLY-42
10.1
8.0
-4.3
33.2
83.8
76.8
-26.7
GLY-42
GLU-43
7.6
6.3
-39.8
-5.9
37.3
15.1
140.9
GLU-43
THR-44
6.6
5.8
-11.8
-8.5
70.3
64.6
38.8
THR-44
GLY-45
4.1
7.1
21.9
8.7
178.0
171.5
-107.0

Graph shows rotational transition at bending residues and can be used
to identify hinge bending residues.
Probably only informative for interdomain rotations greater than 20 degrees
Residue
iResidue
i+1Distance of hinge axis to residue i in
(A) Distance of hinge axis to residue i in
(A) Change in
(deg) Change in
(deg) Angle of psi(i) axis to hinge axis
(deg) Angle of psi(i) axis to hinge axis
(deg) Percentage Progress
PRO-54
VAL-55
11.2
10.1
-6.1
7.3
131.0
119.0
2.5
VAL-55
ASP-56
11.2
9.9
16.9
-35.2
44.8
40.5
-37.7
ASP-56
SER-57
13.8
12.8
34.5
-6.7
15.1
36.2
88.1
SER-57
LEU-58
13.3
12.9
-28.4
3.9
100.1
99.0
-28.4
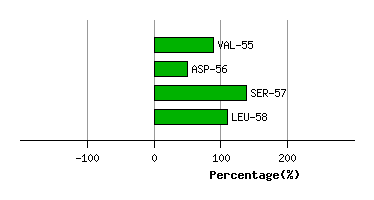
Graph shows rotational transition at bending residues and can be used
to identify hinge bending residues.
Probably only informative for interdomain rotations greater than 20 degrees
Residue
iResidue
i+1Distance of hinge axis to residue i in
(A) Distance of hinge axis to residue i in
(A) Change in
(deg) Change in
(deg) Angle of psi(i) axis to hinge axis
(deg) Angle of psi(i) axis to hinge axis
(deg) Percentage Progress
GLU-245
VAL-246
3.9
4.0
-10.6
11.1
121.7
112.2
-3.3
VAL-246
CYS-247
1.8
1.2
-8.8
4.5
51.3
41.6
11.7
CYS-247
ARG-248
3.7
3.0
-7.6
12.2
122.8
113.9
17.7

Graph shows rotational transition at bending residues and can be used
to identify hinge bending residues.
Probably only informative for interdomain rotations greater than 20 degrees
Residue
iResidue
i+1Distance of hinge axis to residue i in
(A) Distance of hinge axis to residue i in
(A) Change in
(deg) Change in
(deg) Angle of psi(i) axis to hinge axis
(deg) Angle of psi(i) axis to hinge axis
(deg) Percentage Progress
PHE-304
PHE-305
5.7
5.2
-34.3
31.7
60.4
68.1
34.4
PHE-305
ASN-306
2.9
3.7
-20.6
3.0
118.4
107.4
-17.9
ASN-306
THR-307
1.4
2.2
1.4
-3.4
52.4
50.1
-5.3

Graph shows rotational transition at bending residues and can be used
to identify hinge bending residues.
Probably only informative for interdomain rotations greater than 20 degrees