Bifunctional Glutathionylspermidine Synthetase/amidase
(All numbering and residues are taken from first PDB file)
![]()
![]()
Bending Residue Dihedral Analysis
Residue
iResidue
i+1Distance of hinge axis to residue i in
(A) Distance of hinge axis to residue i in
(A) Change in
(deg) Change in
(deg) Angle of psi(i) axis to hinge axis
(deg) Angle of psi(i) axis to hinge axis
(deg) Percentage Progress
VAL-493
ILE-494
14.8
14.5
5.5
-14.0
99.1
94.0
2.9
ILE-494
PRO-495
11.0
10.7
-7.6
-13.2
25.7
25.3
120.5
PRO-495
GLY-496
10.0
9.9
19.7
-8.0
144.1
138.4
-56.7
GLY-496
ASN-497
12.0
12.6
10.6
-21.3
93.1
92.2
-25.0
ASN-497
LYS-498
11.5
11.8
7.2
-5.7
112.9
118.5
-21.2
LYS-498
ALA-499
9.6
9.9
7.8
-7.3
51.0
58.3
9.9
ALA-499
ILE-500
9.2
8.9
4.3
5.3
75.9
81.1
2.6
ILE-500
LEU-501
5.9
5.8
2.3
-7.2
131.6
134.4
6.6
LEU-501
PRO-502
4.2
4.4
-6.8
1.1
103.3
99.1
5.0
PRO-502
ILE-503
4.9
4.9
6.8
-3.6
48.6
48.3
26.3

Graph shows rotational transition at bending residues and can be used
to identify hinge bending residues.
Probably only informative for interdomain rotations greater than 20 degrees
Residue
iResidue
i+1Distance of hinge axis to residue i in
(A) Distance of hinge axis to residue i in
(A) Change in
(deg) Change in
(deg) Angle of psi(i) axis to hinge axis
(deg) Angle of psi(i) axis to hinge axis
(deg) Percentage Progress
TRP-505
SER-506
2.8
2.8
4.3
4.5
129.3
128.4
-42.4
SER-506
LEU-507
5.1
4.9
-18.4
6.4
66.7
72.4
49.7
LEU-507
PHE-508
4.8
4.7
-7.6
7.0
129.7
135.1
-8.7
PHE-508
PRO-509
6.3
6.0
7.6
-8.1
42.6
42.7
-3.7
PRO-509
HIS-510
7.3
6.9
-0.9
7.9
146.6
148.2
39.2

Graph shows rotational transition at bending residues and can be used
to identify hinge bending residues.
Probably only informative for interdomain rotations greater than 20 degrees
Residue
iResidue
i+1Distance of hinge axis to residue i in
(A) Distance of hinge axis to residue i in
(A) Change in
(deg) Change in
(deg) Angle of psi(i) axis to hinge axis
(deg) Angle of psi(i) axis to hinge axis
(deg) Percentage Progress
LEU-514
LEU-515
2.5
1.8
-2.6
-2.1
54.7
57.5
9.2
LEU-515
ASP-516
1.6
1.8
1.3
-2.5
47.8
40.4
-11.3
ASP-516
THR-517
5.1
5.0
0.0
3.2
71.5
76.0
-46.9
THR-517
ASP-518
5.9
6.4
4.1
11.8
33.8
30.9
112.0
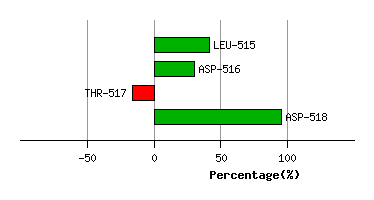
Graph shows rotational transition at bending residues and can be used
to identify hinge bending residues.
Probably only informative for interdomain rotations greater than 20 degrees
Residue
iResidue
i+1Distance of hinge axis to residue i in
(A) Distance of hinge axis to residue i in
(A) Change in
(deg) Change in
(deg) Angle of psi(i) axis to hinge axis
(deg) Angle of psi(i) axis to hinge axis
(deg) Percentage Progress
GLN-568
GLN-569
7.7
7.9
-4.1
14.8
158.4
155.9
82.3
GLN-569
LEU-570
7.1
6.9
-17.9
6.9
129.5
139.1
-63.1
LEU-570
TRP-571
6.9
7.5
-6.0
7.8
111.5
117.1
18.5
TRP-571
CYS-572
3.9
4.6
7.6
5.6
74.1
67.4
58.6
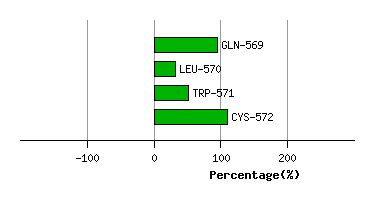
Graph shows rotational transition at bending residues and can be used
to identify hinge bending residues.
Probably only informative for interdomain rotations greater than 20 degrees