Pyruvate Kinase
(All numbering and residues are taken from first PDB file)
![]()
![]()
Bending Residue Dihedral Analysis
Residue
iResidue
i+1Distance of hinge axis to residue i in
(A) Distance of hinge axis to residue i in
(A) Change in
(deg) Change in
(deg) Angle of psi(i) axis to hinge axis
(deg) Angle of psi(i) axis to hinge axis
(deg) Percentage Progress
GLU-88
ILE-89
4.8
3.8
-13.8
20.7
71.4
66.9
14.3
ILE-89
ARG-90
1.3
0.1
22.9
-24.0
71.5
76.9
-10.5
ARG-90
THR-91
4.4
3.9
-12.5
7.0
79.2
74.6
33.1

Graph shows rotational transition at bending residues and can be used
to identify hinge bending residues.
Probably only informative for interdomain rotations greater than 20 degrees
Residue
iResidue
i+1Distance of hinge axis to residue i in
(A) Distance of hinge axis to residue i in
(A) Change in
(deg) Change in
(deg) Angle of psi(i) axis to hinge axis
(deg) Angle of psi(i) axis to hinge axis
(deg) Percentage Progress
TYR-125
ILE-126
9.9
9.8
21.8
-21.8
121.1
114.7
1.3
ILE-126
ASP-127
6.4
6.3
6.7
25.1
39.1
39.3
92.8
ASP-127
TYR-128
3.6
3.1
-56.2
34.6
93.1
103.7
-27.4
TYR-128
GLN-129
3.6
4.5
-7.3
-5.9
64.3
59.0
66.2
TYR-128
GLN-129
3.6
4.5
-7.3
-5.9
64.3
59.0
66.2
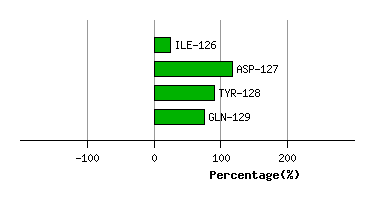
Graph shows rotational transition at bending residues and can be used
to identify hinge bending residues.
Probably only informative for interdomain rotations greater than 20 degrees
Residue
iResidue
i+1Distance of hinge axis to residue i in
(A) Distance of hinge axis to residue i in
(A) Change in
(deg) Change in
(deg) Angle of psi(i) axis to hinge axis
(deg) Angle of psi(i) axis to hinge axis
(deg) Percentage Progress
TYR-128
GLN-129
3.6
4.5
-7.3
-5.9
64.3
59.0
66.2
TYR-128
GLN-129
3.6
4.5
-7.3
-5.9
64.3
59.0
66.2
GLN-129
ASN-130
6.2
6.8
-1.0
1.5
109.2
101.0
12.9
ASN-130
LEU-131
8.9
9.3
-13.4
4.6
161.6
165.4
-31.0

Graph shows rotational transition at bending residues and can be used
to identify hinge bending residues.
Probably only informative for interdomain rotations greater than 20 degrees
Residue
iResidue
i+1Distance of hinge axis to residue i in
(A) Distance of hinge axis to residue i in
(A) Change in
(deg) Change in
(deg) Angle of psi(i) axis to hinge axis
(deg) Angle of psi(i) axis to hinge axis
(deg) Percentage Progress
ARG-174
ARG-175
9.8
9.7
15.3
-53.0
152.0
143.6
112.7
ARG-175
GLY-176
8.3
7.9
20.5
0.6
79.8
86.6
-16.8
GLY-176
VAL-177
5.2
4.4
1.5
2.6
111.8
109.6
-19.7
VAL-177
ASN-178
2.3
2.5
-55.2
46.6
76.7
70.2
15.0
ASN-178
LEU-179
1.1
1.3
-13.0
5.2
76.9
74.9
27.9
LEU-179
PRO-180
4.9
5.1
-7.3
6.1
64.1
62.9
-1.6

Graph shows rotational transition at bending residues and can be used
to identify hinge bending residues.
Probably only informative for interdomain rotations greater than 20 degrees