Endo-1,4-Beta-Xylanase II
(All numbering and residues are taken from first PDB file)
![]()
![]()
Bending Residue Dihedral Analysis
Residue
iResidue
i+1Distance of hinge axis to residue i in
(A) Distance of hinge axis to residue i in
(A) Change in
(deg) Change in
(deg) Angle of psi(i) axis to hinge axis
(deg) Angle of psi(i) axis to hinge axis
(deg) Percentage Progress
SER-75
VAL-76
7.7
7.7
3.9
0.8
31.5
35.4
57.9
VAL-76
TYR-77
5.0
4.9
-13.8
10.2
74.5
74.7
59.7
TYR-77
GLY-78
7.3
7.2
11.0
-8.5
44.4
43.4
45.2

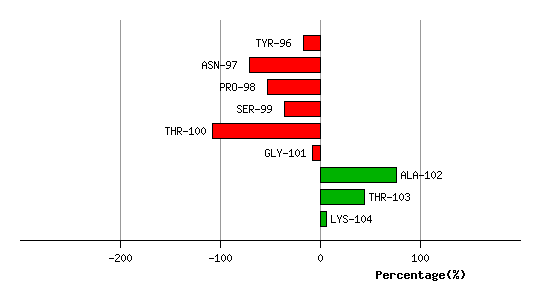
Graph shows rotational transition at bending residues and can be used
to identify hinge bending residues.
Probably only informative for interdomain rotations greater than 20 degrees
Residue
iResidue
i+1Distance of hinge axis to residue i in
(A) Distance of hinge axis to residue i in
(A) Change in
(deg) Change in
(deg) Angle of psi(i) axis to hinge axis
(deg) Angle of psi(i) axis to hinge axis
(deg) Percentage Progress
TYR-87
TYR-88
8.2
8.3
-6.1
6.9
82.1
86.6
38.1
TYR-88
ILE-89
6.2
6.3
-1.9
-3.2
111.8
108.9
0.6
ILE-89
VAL-90
3.2
3.3
-10.8
10.2
93.7
94.2
-20.1

Graph shows rotational transition at bending residues and can be used
to identify hinge bending residues.
Probably only informative for interdomain rotations greater than 20 degrees
Residue
iResidue
i+1Distance of hinge axis to residue i in
(A) Distance of hinge axis to residue i in
(A) Change in
(deg) Change in
(deg) Angle of psi(i) axis to hinge axis
(deg) Angle of psi(i) axis to hinge axis
(deg) Percentage Progress
THR-95
TYR-96
17.6
17.6
11.7
-2.4
115.2
114.0
-96.3
TYR-96
ASN-97
15.2
15.3
-11.0
1.6
111.5
106.4
-54.2
ASN-97
PRO-98
11.5
11.6
5.8
1.7
73.4
77.2
17.9
PRO-98
SER-99
11.6
11.1
-4.6
0.3
69.4
56.4
17.9
SER-99
THR-100
9.2
8.9
6.6
-3.3
155.5
153.8
-72.5
THR-100
GLY-101
11.2
11.3
-5.5
-13.2
87.6
77.8
100.4
GLY-101
ALA-102
12.6
12.2
-2.2
10.6
112.0
113.4
83.7
ALA-102
THR-103
10.6
10.6
1.3
2.4
131.0
122.5
-31.8
THR-103
LYS-104
9.5
9.3
-0.1
-3.7
109.2
116.1
-38.1
Graph shows rotational transition at bending residues and can be used
to identify hinge bending residues.
Probably only informative for interdomain rotations greater than 20 degrees
Residue
iResidue
i+1Distance of hinge axis to residue i in
(A) Distance of hinge axis to residue i in
(A) Change in
(deg) Change in
(deg) Angle of psi(i) axis to hinge axis
(deg) Angle of psi(i) axis to hinge axis
(deg) Percentage Progress
LEU-105
GLY-106
7.5
7.2
3.5
-1.8
83.5
86.8
-18.1
GLY-106
GLU-107
5.7
5.4
-8.2
3.4
67.5
68.6
53.5
GLU-107
VAL-108
4.5
4.3
-3.7
0.5
43.6
44.7
55.0
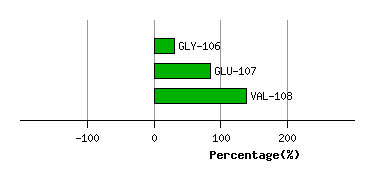
Graph shows rotational transition at bending residues and can be used
to identify hinge bending residues.
Probably only informative for interdomain rotations greater than 20 degrees
Residue
iResidue
i+1Distance of hinge axis to residue i in
(A) Distance of hinge axis to residue i in
(A) Change in
(deg) Change in
(deg) Angle of psi(i) axis to hinge axis
(deg) Angle of psi(i) axis to hinge axis
(deg) Percentage Progress
ILE-117
TYR-118
3.4
3.4
1.2
-4.4
121.2
119.0
30.3
TYR-118
ARG-119
6.5
6.6
-6.1
8.7
127.9
128.0
33.6
ARG-119
THR-120
10.1
10.2
-13.6
16.3
65.9
67.6
-5.5

Graph shows rotational transition at bending residues and can be used
to identify hinge bending residues.
Probably only informative for interdomain rotations greater than 20 degrees
Residue
iResidue
i+1Distance of hinge axis to residue i in
(A) Distance of hinge axis to residue i in
(A) Change in
(deg) Change in
(deg) Angle of psi(i) axis to hinge axis
(deg) Angle of psi(i) axis to hinge axis
(deg) Percentage Progress
GLN-136
TYR-137
12.0
12.0
4.2
4.7
63.9
66.1
128.0
TYR-137
TRP-138
8.6
8.6
0.2
-1.2
94.4
87.9
19.7
TRP-138
SER-139
5.7
5.8
8.4
-16.5
75.2
77.2
-46.4

Graph shows rotational transition at bending residues and can be used
to identify hinge bending residues.
Probably only informative for interdomain rotations greater than 20 degrees
Residue
iResidue
i+1Distance of hinge axis to residue i in
(A) Distance of hinge axis to residue i in
(A) Change in
(deg) Change in
(deg) Angle of psi(i) axis to hinge axis
(deg) Angle of psi(i) axis to hinge axis
(deg) Percentage Progress
ASN-151
THR-152
6.0
5.9
2.4
-1.2
111.3
113.8
-25.3
THR-152
ALA-153
3.7
3.5
4.0
-1.9
109.2
109.7
-0.7
ALA-153
ASN-154
7.4
7.2
-2.5
1.5
11.8
11.5
1.1
ASN-154
HIS-155
7.5
7.4
-0.2
1.2
55.2
55.8
5.0

Graph shows rotational transition at bending residues and can be used
to identify hinge bending residues.
Probably only informative for interdomain rotations greater than 20 degrees
Residue
iResidue
i+1Distance of hinge axis to residue i in
(A) Distance of hinge axis to residue i in
(A) Change in
(deg) Change in
(deg) Angle of psi(i) axis to hinge axis
(deg) Angle of psi(i) axis to hinge axis
(deg) Percentage Progress
THR-165
LEU-166
14.9
14.0
61.1
-64.4
139.8
133.2
77.9
LEU-166
GLY-167
13.0
13.0
-3.3
4.3
39.0
41.9
46.4
GLY-167
THR-168
15.1
15.3
-0.5
3.2
30.5
27.2
-53.6
THR-168
MET-169
14.0
14.4
-2.9
7.9
97.9
95.4
-32.3

Graph shows rotational transition at bending residues and can be used
to identify hinge bending residues.
Probably only informative for interdomain rotations greater than 20 degrees
Residue
iResidue
i+1Distance of hinge axis to residue i in
(A) Distance of hinge axis to residue i in
(A) Change in
(deg) Change in
(deg) Angle of psi(i) axis to hinge axis
(deg) Angle of psi(i) axis to hinge axis
(deg) Percentage Progress
ASP-170
TYR-171
10.9
11.2
-3.1
1.6
84.7
84.1
48.5
TYR-171
GLN-172
8.8
9.0
-5.2
8.2
139.4
140.4
39.4
GLN-172
ILE-173
5.8
5.8
-0.9
-0.4
76.8
76.1
10.9

Graph shows rotational transition at bending residues and can be used
to identify hinge bending residues.
Probably only informative for interdomain rotations greater than 20 degrees