Sarcoplasmic/endoplasmic Reticulum Calcium Atpase 1
(All numbering and residues are taken from first PDB file)
![]()
![]()
Bending Residue Dihedral Analysis
Residue
iResidue
i+1Distance of hinge axis to residue i in
(A) Distance of hinge axis to residue i in
(A) Change in
(deg) Change in
(deg) Angle of psi(i) axis to hinge axis
(deg) Angle of psi(i) axis to hinge axis
(deg) Percentage Progress
PRO-42
ALA-43
13.0
13.3
-96.7
73.4
85.7
75.9
-2.7
ALA-43
GLU-44
12.3
11.6
60.9
-42.9
133.0
148.1
-53.2
GLU-44
GLU-45
15.6
14.5
66.0
41.8
95.6
105.6
-13.4
GLU-45
GLY-46
16.5
13.7
-33.9
-1.6
60.0
36.0
97.9
GLY-46
LYS-47
15.7
16.6
16.3
99.8
52.1
133.7
-24.6
LYS-47
SER-48
13.2
16.0
120.6
89.7
126.0
79.6
145.2
SER-48
LEU-49
12.1
16.6
40.0
79.4
146.1
130.4
-253.4
LEU-49
TRP-50
13.8
19.6
-179.5
0.5
51.4
26.2
471.5
TRP-50
GLU-51
13.4
16.9
-136.4
-44.8
93.4
67.7
-41.6
GLU-51
LEU-52
14.9
15.7
79.5
-84.8
138.8
88.9
-1.6
LEU-52
VAL-53
15.9
19.5
-132.7
-73.0
69.0
47.7
-378.5
VAL-53
ILE-54
19.3
20.1
36.2
-65.5
162.2
136.2
58.0
ILE-54
GLU-55
17.9
16.9
-57.0
6.1
78.1
79.3
30.9
GLU-55
GLN-56
15.6
15.3
0.4
0.0
101.8
94.7
27.9

Graph shows rotational transition at bending residues and can be used
to identify hinge bending residues.
Probably only informative for interdomain rotations greater than 20 degrees
Residue
iResidue
i+1Distance of hinge axis to residue i in
(A) Distance of hinge axis to residue i in
(A) Change in
(deg) Change in
(deg) Angle of psi(i) axis to hinge axis
(deg) Angle of psi(i) axis to hinge axis
(deg) Percentage Progress
LEU-119
LYS-120
4.7
5.4
-15.9
75.1
42.4
36.7
-132.8
LYS-120
GLU-121
6.7
8.2
-62.2
39.0
44.7
27.1
75.0
GLU-121
TYR-122
8.1
8.3
14.3
-20.3
117.9
111.5
-4.1
TYR-122
GLU-123
5.5
5.2
-135.3
74.9
12.8
16.3
180.5
GLU-123
PRO-124
5.0
5.8
6.0
45.4
110.2
106.8
-75.9

Graph shows rotational transition at bending residues and can be used
to identify hinge bending residues.
Probably only informative for interdomain rotations greater than 20 degrees
Residue
iResidue
i+1Distance of hinge axis to residue i in
(A) Distance of hinge axis to residue i in
(A) Change in
(deg) Change in
(deg) Angle of psi(i) axis to hinge axis
(deg) Angle of psi(i) axis to hinge axis
(deg) Percentage Progress
GLN-238
MET-239
21.3
20.6
6.2
36.0
65.9
67.9
29.9
MET-239
ALA-240
19.7
18.9
-2.8
16.0
51.8
70.6
-3.9
ALA-240
ALA-241
20.4
20.9
0.6
70.7
127.6
166.9
-196.3
ALA-241
THR-242
18.6
23.0
108.0
-21.7
72.6
131.4
117.7
THR-242
GLU-243
16.5
20.6
-70.3
86.4
42.6
118.6
129.1
GLU-243
GLN-244
17.2
18.6
157.8
41.1
74.4
108.1
49.4
GLN-244
ASP-245
15.7
17.8
-41.9
-15.8
68.1
59.0
114.9
ASP-245
LYS-246
17.3
21.2
150.1
-31.7
140.9
132.3
-261.2
LYS-246
THR-247
16.5
20.8
-36.8
-31.4
94.2
97.3
-7.9
THR-247
PRO-248
15.7
17.9
-23.7
8.1
45.8
39.5
50.7
PRO-248
LEU-249
18.4
19.4
-10.5
-2.3
24.8
30.2
43.8
LEU-249
GLN-250
16.1
16.6
-51.0
38.2
60.0
67.8
33.6
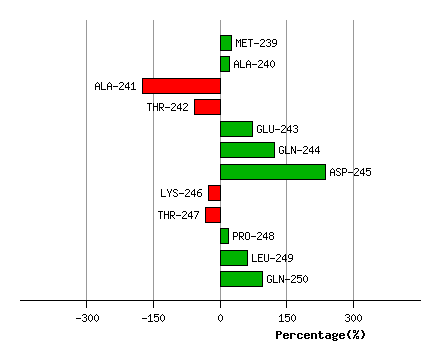
Graph shows rotational transition at bending residues and can be used
to identify hinge bending residues.
Probably only informative for interdomain rotations greater than 20 degrees