Cullin Homolog 1
(All numbering and residues are taken from first PDB file)
![]()
![]()
Bending Residue Dihedral Analysis
Residue
iResidue
i+1Distance of hinge axis to residue i in
(A) Distance of hinge axis to residue i in
(A) Change in
(deg) Change in
(deg) Angle of psi(i) axis to hinge axis
(deg) Angle of psi(i) axis to hinge axis
(deg) Percentage Progress
TYR-244
THR-245
17.9
17.9
3.4
-0.1
160.3
170.2
-42.3
THR-245
ARG-246
19.6
19.3
-14.5
10.6
65.4
67.5
77.9
ARG-246
GLU-247
21.5
21.2
4.5
2.4
95.3
87.5
15.2

Graph shows rotational transition at bending residues and can be used
to identify hinge bending residues.
Probably only informative for interdomain rotations greater than 20 degrees
Residue
iResidue
i+1Distance of hinge axis to residue i in
(A) Distance of hinge axis to residue i in
(A) Change in
(deg) Change in
(deg) Angle of psi(i) axis to hinge axis
(deg) Angle of psi(i) axis to hinge axis
(deg) Percentage Progress
PHE-251
LEU-252
17.0
17.2
0.0
-20.5
24.5
31.5
-105.3
LEU-252
GLN-253
15.5
15.2
-0.6
24.0
138.2
140.7
120.0
GLN-253
GLN-254
17.9
18.2
14.6
-26.4
100.8
96.8
-35.5

Graph shows rotational transition at bending residues and can be used
to identify hinge bending residues.
Probably only informative for interdomain rotations greater than 20 degrees
Residue
iResidue
i+1Distance of hinge axis to residue i in
(A) Distance of hinge axis to residue i in
(A) Change in
(deg) Change in
(deg) Angle of psi(i) axis to hinge axis
(deg) Angle of psi(i) axis to hinge axis
(deg) Percentage Progress
GLU-259
TYR-260
11.2
11.4
-65.5
41.8
101.4
113.5
-129.1
TYR-260
MET-261
10.6
10.8
32.8
-14.6
53.3
60.3
67.1
MET-261
LYS-262
7.0
7.2
5.2
-13.0
32.0
23.2
-43.8

Graph shows rotational transition at bending residues and can be used
to identify hinge bending residues.
Probably only informative for interdomain rotations greater than 20 degrees
Residue
iResidue
i+1Distance of hinge axis to residue i in
(A) Distance of hinge axis to residue i in
(A) Change in
(deg) Change in
(deg) Angle of psi(i) axis to hinge axis
(deg) Angle of psi(i) axis to hinge axis
(deg) Percentage Progress
LEU-268
LEU-269
9.3
8.9
2.3
-8.7
156.7
157.1
38.6
LEU-269
GLU-270
7.0
6.8
2.9
-5.9
134.2
133.3
28.2
GLU-270
GLU-271
10.1
10.1
13.7
-18.9
106.0
108.3
5.3
GLU-271
GLN-272
12.1
11.9
21.1
-0.5
127.5
125.4
-70.2
GLN-272
ARG-273
9.7
9.4
-19.2
1.3
24.5
19.4
105.7
ARG-273
ARG-274
9.2
9.5
27.2
-3.6
118.6
99.4
-78.9

Graph shows rotational transition at bending residues and can be used
to identify hinge bending residues.
Probably only informative for interdomain rotations greater than 20 degrees
Residue
iResidue
i+1Distance of hinge axis to residue i in
(A) Distance of hinge axis to residue i in
(A) Change in
(deg) Change in
(deg) Angle of psi(i) axis to hinge axis
(deg) Angle of psi(i) axis to hinge axis
(deg) Percentage Progress
CYS-291
GLU-292
14.7
14.2
-15.1
-6.3
40.9
38.7
125.2
GLU-292
GLN-293
12.7
12.0
12.3
3.0
151.7
145.2
-98.4
GLN-293
VAL-294
15.5
15.1
-16.7
-5.1
70.7
61.7
63.7
VAL-294
LEU-295
15.8
15.7
1.8
9.0
71.7
80.5
-13.7
VAL-294
LEU-295
15.8
15.7
1.8
9.0
71.7
80.5
-13.7

Graph shows rotational transition at bending residues and can be used
to identify hinge bending residues.
Probably only informative for interdomain rotations greater than 20 degrees
Residue
iResidue
i+1Distance of hinge axis to residue i in
(A) Distance of hinge axis to residue i in
(A) Change in
(deg) Change in
(deg) Angle of psi(i) axis to hinge axis
(deg) Angle of psi(i) axis to hinge axis
(deg) Percentage Progress
VAL-294
LEU-295
15.8
15.7
1.8
9.0
71.7
80.5
-13.7
VAL-294
LEU-295
15.8
15.7
1.8
9.0
71.7
80.5
-13.7
LEU-295
ILE-296
12.4
12.4
33.3
-25.3
44.0
47.5
-12.0
ILE-296
GLU-297
10.6
10.3
164.2
-169.1
66.1
34.2
-0.5
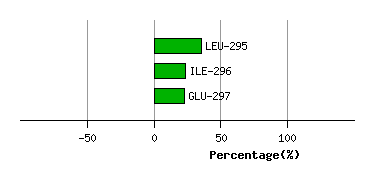
Graph shows rotational transition at bending residues and can be used
to identify hinge bending residues.
Probably only informative for interdomain rotations greater than 20 degrees
Residue
iResidue
i+1Distance of hinge axis to residue i in
(A) Distance of hinge axis to residue i in
(A) Change in
(deg) Change in
(deg) Angle of psi(i) axis to hinge axis
(deg) Angle of psi(i) axis to hinge axis
(deg) Percentage Progress
HIS-304
THR-305
6.2
5.3
-13.9
10.8
49.7
46.3
-3.0
THR-305
GLU-306
6.0
5.3
-0.4
-0.6
114.9
110.8
15.1
GLU-306
PHE-307
5.1
4.8
15.5
-4.1
82.7
79.1
16.3

Graph shows rotational transition at bending residues and can be used
to identify hinge bending residues.
Probably only informative for interdomain rotations greater than 20 degrees
Residue
iResidue
i+1Distance of hinge axis to residue i in
(A) Distance of hinge axis to residue i in
(A) Change in
(deg) Change in
(deg) Angle of psi(i) axis to hinge axis
(deg) Angle of psi(i) axis to hinge axis
(deg) Percentage Progress
ASP-312
ALA-313
5.9
6.9
-9.4
-2.7
66.9
69.4
19.8
ALA-313
ASP-314
8.5
9.7
-11.8
12.1
41.6
38.2
-37.9
ASP-314
LYS-315
9.4
10.6
-0.8
-16.7
25.2
21.2
122.5

Graph shows rotational transition at bending residues and can be used
to identify hinge bending residues.
Probably only informative for interdomain rotations greater than 20 degrees
Residue
iResidue
i+1Distance of hinge axis to residue i in
(A) Distance of hinge axis to residue i in
(A) Change in
(deg) Change in
(deg) Angle of psi(i) axis to hinge axis
(deg) Angle of psi(i) axis to hinge axis
(deg) Percentage Progress
LEU-319
GLY-320
2.7
3.6
-2.5
-1.0
144.8
145.2
-18.9
GLY-320
ARG-321
3.5
4.5
5.4
4.1
65.4
61.8
18.4
ARG-321
MET-322
0.6
1.9
-20.0
8.7
52.0
63.8
27.5

Graph shows rotational transition at bending residues and can be used
to identify hinge bending residues.
Probably only informative for interdomain rotations greater than 20 degrees
Residue
iResidue
i+1Distance of hinge axis to residue i in
(A) Distance of hinge axis to residue i in
(A) Change in
(deg) Change in
(deg) Angle of psi(i) axis to hinge axis
(deg) Angle of psi(i) axis to hinge axis
(deg) Percentage Progress
TYR-323
ASN-324
4.0
3.2
-5.5
11.9
28.8
26.5
103.0
ASN-324
LEU-325
4.2
3.0
14.7
-29.4
90.3
94.2
-51.2
LEU-325
VAL-326
5.3
4.1
11.4
-1.8
64.1
64.0
42.2

Graph shows rotational transition at bending residues and can be used
to identify hinge bending residues.
Probably only informative for interdomain rotations greater than 20 degrees
Residue
iResidue
i+1Distance of hinge axis to residue i in
(A) Distance of hinge axis to residue i in
(A) Change in
(deg) Change in
(deg) Angle of psi(i) axis to hinge axis
(deg) Angle of psi(i) axis to hinge axis
(deg) Percentage Progress
ARG-328
ILE-329
9.9
9.1
54.2
-52.0
115.7
113.6
20.6
ILE-329
GLN-330
12.5
11.7
2.7
6.7
107.4
107.3
-17.1
GLN-330
ASP-331
15.3
14.7
-21.6
4.3
1.5
10.2
115.6

Graph shows rotational transition at bending residues and can be used
to identify hinge bending residues.
Probably only informative for interdomain rotations greater than 20 degrees