Threonine Synthase
(All numbering and residues are taken from first PDB file)
![]()
![]()
Bending Residue Dihedral Analysis
Residue
iResidue
i+1Distance of hinge axis to residue i in
(A) Distance of hinge axis to residue i in
(A) Change in
(deg) Change in
(deg) Angle of psi(i) axis to hinge axis
(deg) Angle of psi(i) axis to hinge axis
(deg) Percentage Progress
GLY-14
VAL-15
9.4
9.6
-1.7
23.5
102.6
114.1
339.8
VAL-15
ILE-16
11.1
11.1
-19.3
10.1
160.3
164.7
-353.6
ILE-16
ALA-17
9.1
9.0
6.0
-7.5
54.2
52.9
-40.5

Graph shows rotational transition at bending residues and can be used
to identify hinge bending residues.
Probably only informative for interdomain rotations greater than 20 degrees
Residue
iResidue
i+1Distance of hinge axis to residue i in
(A) Distance of hinge axis to residue i in
(A) Change in
(deg) Change in
(deg) Angle of psi(i) axis to hinge axis
(deg) Angle of psi(i) axis to hinge axis
(deg) Percentage Progress
ALA-18
TYR-19
14.0
14.1
-16.2
13.6
60.2
54.6
181.3
TYR-19
ARG-20
14.1
14.0
-4.9
7.9
45.5
46.0
-53.7
ARG-20
ASP-21
11.4
11.2
6.3
-3.9
136.7
139.0
-118.5
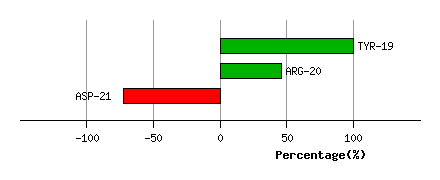
Graph shows rotational transition at bending residues and can be used
to identify hinge bending residues.
Probably only informative for interdomain rotations greater than 20 degrees
Residue
iResidue
i+1Distance of hinge axis to residue i in
(A) Distance of hinge axis to residue i in
(A) Change in
(deg) Change in
(deg) Angle of psi(i) axis to hinge axis
(deg) Angle of psi(i) axis to hinge axis
(deg) Percentage Progress
PRO-24
VAL-25
10.8
10.7
9.2
0.9
96.3
99.3
-40.8
VAL-25
GLY-26
7.1
6.9
-7.8
2.1
148.8
150.6
-80.0
GLY-26
ASP-27
4.9
4.7
-6.1
-33.2
83.6
84.8
50.1
ASP-27
ASP-28
4.4
3.6
73.6
-43.6
109.5
77.6
198.4
ASP-28
TRP-29
1.4
1.2
9.7
-6.1
165.8
172.1
-93.9
TRP-29
THR-30
0.4
0.3
-27.6
7.6
125.1
123.8
-274.5
TRP-29
THR-30
0.4
0.3
-27.6
7.6
125.1
123.8
-274.5

Graph shows rotational transition at bending residues and can be used
to identify hinge bending residues.
Probably only informative for interdomain rotations greater than 20 degrees
Residue
iResidue
i+1Distance of hinge axis to residue i in
(A) Distance of hinge axis to residue i in
(A) Change in
(deg) Change in
(deg) Angle of psi(i) axis to hinge axis
(deg) Angle of psi(i) axis to hinge axis
(deg) Percentage Progress
TRP-29
THR-30
0.4
0.3
-27.6
7.6
125.1
123.8
-274.5
TRP-29
THR-30
0.4
0.3
-27.6
7.6
125.1
123.8
-274.5
THR-30
PRO-31
2.8
2.8
14.3
-2.7
35.0
31.0
355.1
PRO-31
VAL-32
3.2
3.2
4.8
10.9
32.4
32.5
90.1
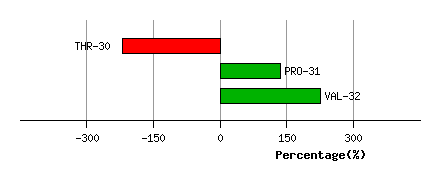
Graph shows rotational transition at bending residues and can be used
to identify hinge bending residues.
Probably only informative for interdomain rotations greater than 20 degrees
Residue
iResidue
i+1Distance of hinge axis to residue i in
(A) Distance of hinge axis to residue i in
(A) Change in
(deg) Change in
(deg) Angle of psi(i) axis to hinge axis
(deg) Angle of psi(i) axis to hinge axis
(deg) Percentage Progress
THR-74
MET-75
5.1
5.6
8.9
1.2
31.7
23.7
498.6
MET-75
ALA-76
7.3
7.3
-5.7
11.9
94.2
93.7
-136.5
ALA-76
VAL-77
8.2
8.3
-2.2
-2.5
95.1
93.7
-54.1

Graph shows rotational transition at bending residues and can be used
to identify hinge bending residues.
Probably only informative for interdomain rotations greater than 20 degrees
Residue
iResidue
i+1Distance of hinge axis to residue i in
(A) Distance of hinge axis to residue i in
(A) Change in
(deg) Change in
(deg) Angle of psi(i) axis to hinge axis
(deg) Angle of psi(i) axis to hinge axis
(deg) Percentage Progress
ARG-86
ALA-87
13.0
12.7
6.6
-3.9
21.2
19.9
129.1
ALA-87
VAL-88
12.8
12.8
-2.2
6.2
91.3
89.6
-367.1
VAL-88
LEU-89
11.3
11.8
25.0
1.5
34.7
31.7
875.0
LEU-89
CYS-90
14.0
14.3
-7.6
19.7
106.5
114.7
295.4

Graph shows rotational transition at bending residues and can be used
to identify hinge bending residues.
Probably only informative for interdomain rotations greater than 20 degrees
Residue
iResidue
i+1Distance of hinge axis to residue i in
(A) Distance of hinge axis to residue i in
(A) Change in
(deg) Change in
(deg) Angle of psi(i) axis to hinge axis
(deg) Angle of psi(i) axis to hinge axis
(deg) Percentage Progress
THR-93
GLY-94
14.0
13.8
-25.5
25.0
92.8
91.5
84.1
GLY-94
ASN-95
12.8
12.8
2.7
5.2
114.7
116.8
-170.1
ASN-95
THR-96
10.5
10.5
-5.7
3.7
19.3
21.6
25.9
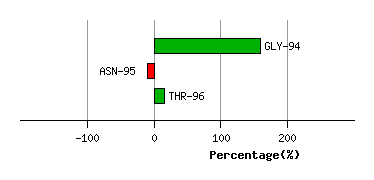
Graph shows rotational transition at bending residues and can be used
to identify hinge bending residues.
Probably only informative for interdomain rotations greater than 20 degrees
Residue
iResidue
i+1Distance of hinge axis to residue i in
(A) Distance of hinge axis to residue i in
(A) Change in
(deg) Change in
(deg) Angle of psi(i) axis to hinge axis
(deg) Angle of psi(i) axis to hinge axis
(deg) Percentage Progress
GLY-108
ILE-109
8.3
8.3
-17.4
21.9
106.0
107.0
297.2
ILE-109
THR-110
9.2
9.4
18.8
-7.6
145.5
151.9
-312.3
THR-110
CYS-111
11.6
11.6
-3.5
13.4
77.6
75.6
111.8

Graph shows rotational transition at bending residues and can be used
to identify hinge bending residues.
Probably only informative for interdomain rotations greater than 20 degrees
Residue
iResidue
i+1Distance of hinge axis to residue i in
(A) Distance of hinge axis to residue i in
(A) Change in
(deg) Change in
(deg) Angle of psi(i) axis to hinge axis
(deg) Angle of psi(i) axis to hinge axis
(deg) Percentage Progress
ARG-150
LYS-151
22.5
22.4
0.9
-2.7
126.4
126.6
-36.1
LYS-151
MET-152
24.8
24.7
-9.7
6.8
70.3
72.4
38.3
MET-152
ALA-153
22.2
22.2
10.3
-5.8
137.9
134.3
-136.8

Graph shows rotational transition at bending residues and can be used
to identify hinge bending residues.
Probably only informative for interdomain rotations greater than 20 degrees
Residue
iResidue
i+1Distance of hinge axis to residue i in
(A) Distance of hinge axis to residue i in
(A) Change in
(deg) Change in
(deg) Angle of psi(i) axis to hinge axis
(deg) Angle of psi(i) axis to hinge axis
(deg) Percentage Progress
ASP-155
PHE-156
23.6
23.8
23.9
-11.6
75.5
84.3
195.4
PHE-156
PRO-157
20.5
20.8
13.5
-12.6
71.8
68.0
166.7
PRO-157
THR-158
17.7
18.0
8.9
-15.4
104.0
105.5
67.2

Graph shows rotational transition at bending residues and can be used
to identify hinge bending residues.
Probably only informative for interdomain rotations greater than 20 degrees
Residue
iResidue
i+1Distance of hinge axis to residue i in
(A) Distance of hinge axis to residue i in
(A) Change in
(deg) Change in
(deg) Angle of psi(i) axis to hinge axis
(deg) Angle of psi(i) axis to hinge axis
(deg) Percentage Progress
ILE-159
SER-160
15.6
15.8
-24.3
21.0
75.4
82.8
109.3
SER-160
LEU-161
13.7
14.0
26.7
-19.6
32.7
27.9
217.4
LEU-161
VAL-162
15.5
15.4
6.7
-0.2
87.9
86.9
64.2

Graph shows rotational transition at bending residues and can be used
to identify hinge bending residues.
Probably only informative for interdomain rotations greater than 20 degrees