Aerolysin
(All numbering and residues are taken from first PDB file)
![]()
![]()
Bending Residue Dihedral Analysis
Residue
iResidue
i+1Distance of hinge axis to residue i in
(A) Distance of hinge axis to residue i in
(A) Change in
(deg) Change in
(deg) Angle of psi(i) axis to hinge axis
(deg) Angle of psi(i) axis to hinge axis
(deg) Percentage Progress
ARG-194
GLN-195
8.3
8.4
17.2
-7.9
29.9
26.4
137.1
GLN-195
LEU-196
7.3
7.2
-2.0
-3.4
90.9
91.0
52.1
LEU-196
VAL-197
9.9
9.9
-4.8
-6.5
120.5
116.8
-104.0
VAL-197
LYS-198
9.0
9.0
9.6
-13.0
61.6
69.8
-68.7
LYS-198
THR-199
12.7
12.7
-11.6
1.4
67.9
71.2
142.9
THR-199
VAL-200
16.1
16.1
-0.7
-0.2
91.5
91.4
-6.4
VAL-200
VAL-201
18.9
19.1
-7.8
-0.7
96.2
99.5
-11.7

Graph shows rotational transition at bending residues and can be used
to identify hinge bending residues.
Probably only informative for interdomain rotations greater than 20 degrees
Residue
iResidue
i+1Distance of hinge axis to residue i in
(A) Distance of hinge axis to residue i in
(A) Change in
(deg) Change in
(deg) Angle of psi(i) axis to hinge axis
(deg) Angle of psi(i) axis to hinge axis
(deg) Percentage Progress
GLY-221
ASP-222
18.1
17.8
-15.7
8.9
115.9
121.8
-110.7
ASP-222
THR-223
14.6
14.6
13.5
-29.2
128.8
132.5
184.1
THR-223
ALA-224
11.1
11.3
4.9
8.1
51.0
49.6
105.5
ALA-224
THR-225
8.4
8.4
18.5
-12.5
82.8
85.5
121.3
ALA-224
THR-225
8.4
8.4
18.5
-12.5
82.8
85.5
121.3

Graph shows rotational transition at bending residues and can be used
to identify hinge bending residues.
Probably only informative for interdomain rotations greater than 20 degrees
Residue
iResidue
i+1Distance of hinge axis to residue i in
(A) Distance of hinge axis to residue i in
(A) Change in
(deg) Change in
(deg) Angle of psi(i) axis to hinge axis
(deg) Angle of psi(i) axis to hinge axis
(deg) Percentage Progress
ALA-224
THR-225
8.4
8.4
18.5
-12.5
82.8
85.5
121.3
ALA-224
THR-225
8.4
8.4
18.5
-12.5
82.8
85.5
121.3
THR-225
ASN-226
4.7
4.7
3.0
-2.3
98.8
95.5
25.6
ASN-226
TRP-227
4.8
4.5
1.8
-1.9
101.3
105.7
-24.3
TRP-227
SER-228
3.9
3.7
-0.9
-8.8
116.3
115.2
-144.0
TRP-227
SER-228
3.9
3.7
-0.9
-8.8
116.3
115.2
-144.0

Graph shows rotational transition at bending residues and can be used
to identify hinge bending residues.
Probably only informative for interdomain rotations greater than 20 degrees
Residue
iResidue
i+1Distance of hinge axis to residue i in
(A) Distance of hinge axis to residue i in
(A) Change in
(deg) Change in
(deg) Angle of psi(i) axis to hinge axis
(deg) Angle of psi(i) axis to hinge axis
(deg) Percentage Progress
TRP-227
SER-228
3.9
3.7
-0.9
-8.8
116.3
115.2
-144.0
TRP-227
SER-228
3.9
3.7
-0.9
-8.8
116.3
115.2
-144.0
SER-228
LYS-229
6.8
6.7
10.1
-7.4
64.9
70.2
102.2
LYS-229
THR-230
8.2
8.5
21.4
-13.0
71.5
73.1
52.1

Graph shows rotational transition at bending residues and can be used
to identify hinge bending residues.
Probably only informative for interdomain rotations greater than 20 degrees
Residue
iResidue
i+1Distance of hinge axis to residue i in
(A) Distance of hinge axis to residue i in
(A) Change in
(deg) Change in
(deg) Angle of psi(i) axis to hinge axis
(deg) Angle of psi(i) axis to hinge axis
(deg) Percentage Progress
SER-267
GLN-268
11.0
11.1
9.6
-12.2
54.2
58.2
61.6
GLN-268
ASN-269
7.6
7.7
-2.8
-1.9
148.9
146.6
-114.3
ASN-269
GLY-270
8.8
8.7
18.8
-1.2
34.1
34.5
259.8
GLY-270
GLY-271
6.8
6.7
-14.9
21.6
99.7
91.4
37.4
GLY-271
SER-272
8.2
7.8
-7.6
-11.2
119.5
129.7
-195.0
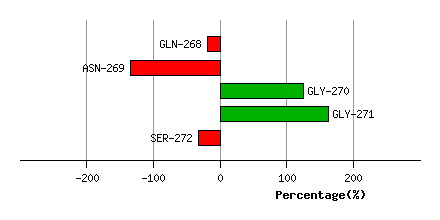
Graph shows rotational transition at bending residues and can be used
to identify hinge bending residues.
Probably only informative for interdomain rotations greater than 20 degrees
Residue
iResidue
i+1Distance of hinge axis to residue i in
(A) Distance of hinge axis to residue i in
(A) Change in
(deg) Change in
(deg) Angle of psi(i) axis to hinge axis
(deg) Angle of psi(i) axis to hinge axis
(deg) Percentage Progress
THR-273
THR-274
7.4
7.5
7.4
-5.9
56.3
57.4
26.3
THR-274
THR-275
10.3
10.4
-29.5
53.8
69.6
74.3
-116.8
THR-275
SER-276
10.7
10.4
13.0
-26.4
68.2
78.4
85.5

Graph shows rotational transition at bending residues and can be used
to identify hinge bending residues.
Probably only informative for interdomain rotations greater than 20 degrees
Residue
iResidue
i+1Distance of hinge axis to residue i in
(A) Distance of hinge axis to residue i in
(A) Change in
(deg) Change in
(deg) Angle of psi(i) axis to hinge axis
(deg) Angle of psi(i) axis to hinge axis
(deg) Percentage Progress
ALA-300
ASP-301
4.5
4.6
-2.8
8.1
121.6
117.0
50.5
ASP-301
ILE-302
3.2
3.4
-10.3
12.0
104.4
108.8
-33.9
ILE-302
SER-303
6.0
6.2
-2.7
9.1
118.7
115.0
154.8
SER-303
TYR-304
8.2
8.5
-3.1
-6.1
107.5
112.9
-68.9

Graph shows rotational transition at bending residues and can be used
to identify hinge bending residues.
Probably only informative for interdomain rotations greater than 20 degrees
Residue
iResidue
i+1Distance of hinge axis to residue i in
(A) Distance of hinge axis to residue i in
(A) Change in
(deg) Change in
(deg) Angle of psi(i) axis to hinge axis
(deg) Angle of psi(i) axis to hinge axis
(deg) Percentage Progress
ASP-403
PHE-404
11.7
11.7
2.1
-5.7
91.2
93.0
9.7
PHE-404
SER-405
8.1
8.0
6.0
-7.8
17.5
18.4
-52.5
SER-405
ALA-406
6.1
5.9
8.8
-2.6
93.4
95.3
61.7
ALA-406
GLU-407
2.3
2.2
6.3
-5.3
27.0
28.2
14.4
GLU-407
SER-408
0.8
0.5
10.3
-19.7
107.5
110.4
-25.5
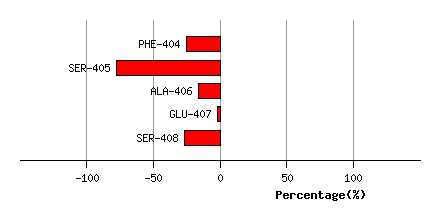
Graph shows rotational transition at bending residues and can be used
to identify hinge bending residues.
Probably only informative for interdomain rotations greater than 20 degrees