Glycogen [Starch] Synthase Isoform 2
(All numbering and residues are taken from first PDB file)
![]()
![]()
Bending Residue Dihedral Analysis
Residue
iResidue
i+1Distance of hinge axis to residue i in
(A) Distance of hinge axis to residue i in
(A) Change in
(deg) Change in
(deg) Angle of psi(i) axis to hinge axis
(deg) Angle of psi(i) axis to hinge axis
(deg) Percentage Progress
ARG-199
TYR-200
2.9
3.5
15.2
-18.1
21.9
23.7
-20.8
TYR-200
LEU-201
3.5
3.9
13.9
-10.0
69.0
66.3
8.1
LEU-201
CYS-202
0.2
0.2
1.7
3.4
111.3
108.9
18.4
CYS-202
ALA-203
2.9
2.8
-9.9
4.8
104.1
109.2
1.1
ALA-203
SER-204
5.3
5.5
-0.2
-13.8
143.9
147.9
-93.9
SER-204
GLY-205
5.4
5.3
-4.7
-0.4
82.7
87.0
-58.7
GLY-205
SER-206
7.7
6.8
21.5
20.5
53.8
39.5
219.2
SER-206
PHE-207
8.0
5.7
38.6
-104.5
104.1
99.0
201.2
PHE-207
ASP-208
6.7
7.3
36.6
2.7
147.7
168.0
-273.1
ASP-208
PHE-209
9.3
9.2
9.8
-0.4
114.6
112.6
-8.1
PHE-209
TYR-210
6.7
6.4
5.5
-0.6
127.3
133.4
-23.7
TYR-210
ASN-211
9.1
8.6
-26.4
24.6
104.4
98.5
-12.8
ASN-211
CYS-212
12.3
12.1
1.1
9.5
36.7
39.2
127.6
CYS-212
LEU-213
11.4
11.2
-17.0
3.9
93.3
98.3
-112.5
LEU-213
GLU-214
9.2
9.2
-10.2
13.9
93.7
105.2
-31.4
GLU-214
SER-215
12.8
12.6
-7.0
15.9
164.9
167.5
75.1
SER-215
VAL-216
12.4
12.3
-19.3
13.7
114.9
119.2
-2.0
VAL-216
ASP-217
9.4
9.3
0.4
2.9
76.7
79.8
-22.3
ASP-217
VAL-218
10.6
10.9
9.7
-0.5
111.4
109.1
0.4
VAL-218
ASP-219
10.3
10.5
-4.0
3.0
124.3
130.4
24.0
ASP-219
HIS-220
11.9
12.3
0.0
-28.6
129.8
131.9
-92.8
HIS-220
GLU-221
9.1
9.6
36.9
-5.7
116.0
109.0
39.6
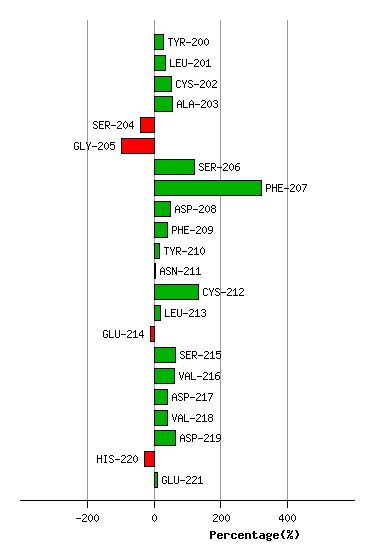
Graph shows rotational transition at bending residues and can be used
to identify hinge bending residues.
Probably only informative for interdomain rotations greater than 20 degrees
Residue
iResidue
i+1Distance of hinge axis to residue i in
(A) Distance of hinge axis to residue i in
(A) Change in
(deg) Change in
(deg) Angle of psi(i) axis to hinge axis
(deg) Angle of psi(i) axis to hinge axis
(deg) Percentage Progress
ASN-269
GLY-270
4.6
4.7
14.3
-21.5
149.9
150.9
75.1
GLY-270
LEU-271
4.5
4.6
6.7
1.4
97.4
95.3
-27.8
LEU-271
ASN-272
6.2
6.6
1.7
1.9
161.7
154.3
-15.5
ASN-272
VAL-273
8.2
9.0
-7.1
2.7
69.1
56.1
24.0
VAL-273
ILE-274
7.0
7.5
-10.7
-8.8
37.0
33.6
102.4
ILE-274
LYS-275
10.1
10.5
-25.5
29.5
54.0
48.8
-86.4

Graph shows rotational transition at bending residues and can be used
to identify hinge bending residues.
Probably only informative for interdomain rotations greater than 20 degrees
Residue
iResidue
i+1Distance of hinge axis to residue i in
(A) Distance of hinge axis to residue i in
(A) Change in
(deg) Change in
(deg) Angle of psi(i) axis to hinge axis
(deg) Angle of psi(i) axis to hinge axis
(deg) Percentage Progress
ASP-595
LEU-596
2.0
2.1
-0.3
-2.0
51.4
49.1
31.8
LEU-596
LEU-597
2.8
2.7
-7.5
-2.8
38.3
44.1
38.3
LEU-597
ASP-598
0.7
0.9
6.7
8.6
72.0
66.9
48.0
ASP-598
TRP-599
3.0
3.0
-10.0
-1.8
79.9
73.2
12.8
TRP-599
LYS-600
6.2
6.4
7.0
-6.1
46.0
46.0
-30.5
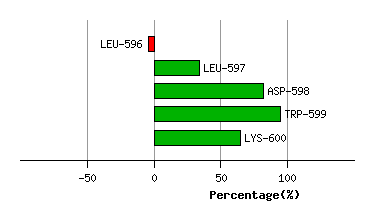
Graph shows rotational transition at bending residues and can be used
to identify hinge bending residues.
Probably only informative for interdomain rotations greater than 20 degrees