S-Adenosylhomocysteine Hydrolase
(All numbering and residues are taken from first PDB file)
![]()
![]()
Bending Residue Dihedral Analysis
Residue
iResidue
i+1Distance of hinge axis to residue i in
(A) Distance of hinge axis to residue i in
(A) Change in
(deg) Change in
(deg) Angle of psi(i) axis to hinge axis
(deg) Angle of psi(i) axis to hinge axis
(deg) Percentage Progress
ASP-181
SER-182
2.9
2.7
2.4
-6.8
115.1
116.8
40.5
SER-182
VAL-183
1.6
1.7
7.2
-7.3
110.4
106.1
-4.1
VAL-183
THR-184
2.3
2.3
-14.2
12.6
21.4
24.9
33.4
THR-184
LYS-185
1.3
1.4
14.3
-26.9
94.9
94.4
30.6
LYS-185
SER-186
2.8
2.6
17.4
-5.0
71.7
61.7
50.4
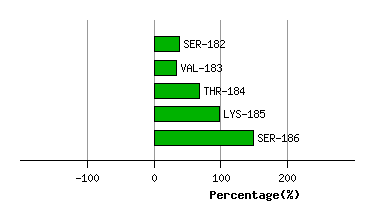
Graph shows rotational transition at bending residues and can be used
to identify hinge bending residues.
Probably only informative for interdomain rotations greater than 20 degrees
Residue
iResidue
i+1Distance of hinge axis to residue i in
(A) Distance of hinge axis to residue i in
(A) Change in
(deg) Change in
(deg) Angle of psi(i) axis to hinge axis
(deg) Angle of psi(i) axis to hinge axis
(deg) Percentage Progress
SER-354
PHE-355
7.6
7.5
-3.8
-4.7
60.1
64.7
28.6
PHE-355
VAL-356
4.4
4.3
-0.7
3.9
3.0
1.4
-36.2
VAL-356
MET-357
5.6
5.6
-15.4
13.4
76.6
72.3
64.9
MET-357
SER-358
6.9
6.7
2.5
-3.6
82.5
84.5
21.9
SER-358
ASN-359
4.4
4.3
1.9
0.4
144.4
142.8
-57.5

Graph shows rotational transition at bending residues and can be used
to identify hinge bending residues.
Probably only informative for interdomain rotations greater than 20 degrees
Residue
iResidue
i+1Distance of hinge axis to residue i in
(A) Distance of hinge axis to residue i in
(A) Change in
(deg) Change in
(deg) Angle of psi(i) axis to hinge axis
(deg) Angle of psi(i) axis to hinge axis
(deg) Percentage Progress
HIS-383
PHE-384
9.8
10.1
-9.5
-7.0
44.2
45.2
106.1
PHE-384
LEU-385
7.0
7.4
-17.7
4.6
42.6
45.7
101.9
LEU-385
PRO-386
7.8
8.2
12.2
-10.2
82.4
80.8
15.8

Graph shows rotational transition at bending residues and can be used
to identify hinge bending residues.
Probably only informative for interdomain rotations greater than 20 degrees
Residue
iResidue
i+1Distance of hinge axis to residue i in
(A) Distance of hinge axis to residue i in
(A) Change in
(deg) Change in
(deg) Angle of psi(i) axis to hinge axis
(deg) Angle of psi(i) axis to hinge axis
(deg) Percentage Progress
ASP-390
GLU-391
6.2
6.1
-9.0
13.1
130.0
136.2
32.2
GLU-391
ALA-392
8.4
8.3
-3.8
7.2
153.8
151.3
38.8
ALA-392
VAL-393
9.2
8.9
1.3
5.4
55.8
56.3
48.7
VAL-393
ALA-394
5.9
5.4
-4.7
-8.6
69.6
61.3
96.1
VAL-393
ALA-394
5.9
5.4
-4.7
-8.6
69.6
61.3
96.1
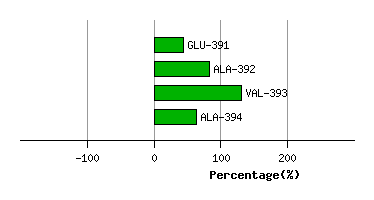
Graph shows rotational transition at bending residues and can be used
to identify hinge bending residues.
Probably only informative for interdomain rotations greater than 20 degrees
Residue
iResidue
i+1Distance of hinge axis to residue i in
(A) Distance of hinge axis to residue i in
(A) Change in
(deg) Change in
(deg) Angle of psi(i) axis to hinge axis
(deg) Angle of psi(i) axis to hinge axis
(deg) Percentage Progress
VAL-393
ALA-394
5.9
5.4
-4.7
-8.6
69.6
61.3
96.1
VAL-393
ALA-394
5.9
5.4
-4.7
-8.6
69.6
61.3
96.1
ALA-394
GLU-395
5.5
5.5
-10.7
18.8
35.7
38.7
-79.0
GLU-395
ALA-396
8.4
8.6
-5.8
-7.1
32.5
32.0
132.4
ALA-396
HIS-397
6.9
6.8
15.8
-20.0
56.2
59.2
-17.0
ALA-396
HIS-397
6.9
6.8
15.8
-20.0
56.2
59.2
-17.0
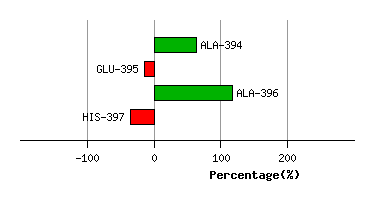
Graph shows rotational transition at bending residues and can be used
to identify hinge bending residues.
Probably only informative for interdomain rotations greater than 20 degrees
Residue
iResidue
i+1Distance of hinge axis to residue i in
(A) Distance of hinge axis to residue i in
(A) Change in
(deg) Change in
(deg) Angle of psi(i) axis to hinge axis
(deg) Angle of psi(i) axis to hinge axis
(deg) Percentage Progress
ALA-396
HIS-397
6.9
6.8
15.8
-20.0
56.2
59.2
-17.0
ALA-396
HIS-397
6.9
6.8
15.8
-20.0
56.2
59.2
-17.0
HIS-397
LEU-398
4.4
4.5
8.2
7.8
69.3
70.0
25.2
LEU-398
GLY-399
7.9
7.9
-159.3
165.2
152.2
170.3
58.1
GLY-399
LYS-400
8.4
7.7
1.9
30.2
54.2
58.6
80.3
LYS-400
LEU-401
5.3
4.8
-19.6
-11.3
80.4
93.4
-18.0
LEU-401
ASN-402
7.6
7.7
9.1
-10.8
66.9
78.9
-19.8
ASN-402
VAL-403
10.5
10.3
27.2
-11.6
135.0
130.0
-79.6
VAL-403
LYS-404
12.1
12.4
-4.4
25.5
91.8
82.7
-24.7
LYS-404
LEU-405
15.0
15.4
14.9
-9.0
157.2
164.7
-47.7

Graph shows rotational transition at bending residues and can be used
to identify hinge bending residues.
Probably only informative for interdomain rotations greater than 20 degrees