Methyltransferase
(All numbering and residues are taken from first PDB file)
![]()
![]()
Bending Residue Dihedral Analysis
Residue
iResidue
i+1Distance of hinge axis to residue i in
(A) Distance of hinge axis to residue i in
(A) Change in
(deg) Change in
(deg) Angle of psi(i) axis to hinge axis
(deg) Angle of psi(i) axis to hinge axis
(deg) Percentage Progress
PRO-136
ARG-137
22.1
22.2
-11.0
4.0
148.2
150.2
-108.6
ARG-137
PHE-138
24.0
24.0
0.1
-4.1
55.9
60.5
-101.5
PHE-138
HIS-139
21.0
21.0
20.4
-7.0
58.7
56.4
137.4
HIS-139
LYS-140
19.0
19.1
5.0
-2.6
42.3
32.7
-10.1
LYS-140
LEU-141
21.9
21.9
4.1
11.0
34.5
51.4
250.7
LEU-141
MET-142
21.9
21.5
-8.2
7.0
117.0
116.0
-26.5
MET-142
ALA-143
18.1
17.7
-1.1
-7.4
124.5
139.4
-87.1
ALA-143
GLU-144
18.4
18.4
5.1
0.8
32.4
36.1
72.8
GLU-144
MET-145
21.2
20.9
-2.1
1.1
133.2
120.3
-42.2
MET-145
SER-146
19.2
18.5
-3.0
-0.1
114.2
118.2
20.8
SER-146
GLY-147
15.9
15.4
-2.9
-1.8
128.1
139.3
-79.6
GLY-147
MET-148
18.2
17.9
10.1
4.6
22.4
29.4
243.9
MET-148
VAL-149
19.2
18.5
-5.3
-3.3
119.5
121.3
-96.8
VAL-149
PHE-150
15.6
14.8
2.1
-2.6
71.8
71.9
-36.8
PHE-150
ASP-151
14.5
14.5
3.5
-12.4
33.8
34.3
-122.4
ASP-151
ALA-152
17.4
17.4
7.3
-4.1
35.8
34.0
56.8

Graph shows rotational transition at bending residues and can be used
to identify hinge bending residues.
Probably only informative for interdomain rotations greater than 20 degrees
Residue
iResidue
i+1Distance of hinge axis to residue i in
(A) Distance of hinge axis to residue i in
(A) Change in
(deg) Change in
(deg) Angle of psi(i) axis to hinge axis
(deg) Angle of psi(i) axis to hinge axis
(deg) Percentage Progress
VAL-244
PHE-245
6.6
6.6
-10.1
7.8
73.0
77.5
31.4
PHE-245
ASP-246
7.8
8.0
0.1
-15.4
40.6
37.1
-158.2
ASP-246
ALA-247
7.8
8.2
49.8
-37.5
15.2
27.8
159.7
ALA-247
ILE-248
7.3
7.4
-0.1
0.6
127.9
124.0
58.6
ILE-248
HIS-249
3.8
3.8
-4.8
2.8
130.3
131.6
-1.4

Graph shows rotational transition at bending residues and can be used
to identify hinge bending residues.
Probably only informative for interdomain rotations greater than 20 degrees
Residue
iResidue
i+1Distance of hinge axis to residue i in
(A) Distance of hinge axis to residue i in
(A) Change in
(deg) Change in
(deg) Angle of psi(i) axis to hinge axis
(deg) Angle of psi(i) axis to hinge axis
(deg) Percentage Progress
GLN-251
ALA-252
5.1
5.0
-0.6
2.6
153.4
155.1
-25.6
ALA-252
GLN-253
4.3
4.1
-2.6
2.2
86.1
84.1
42.5
GLN-253
PRO-254
2.4
2.2
4.7
-4.7
163.1
164.5
-37.0

Graph shows rotational transition at bending residues and can be used
to identify hinge bending residues.
Probably only informative for interdomain rotations greater than 20 degrees
Residue
iResidue
i+1Distance of hinge axis to residue i in
(A) Distance of hinge axis to residue i in
(A) Change in
(deg) Change in
(deg) Angle of psi(i) axis to hinge axis
(deg) Angle of psi(i) axis to hinge axis
(deg) Percentage Progress
ALA-255
ARG-256
4.1
4.1
1.2
2.1
92.0
95.1
-12.0
ARG-256
VAL-257
6.2
6.0
-1.0
-0.2
139.8
138.9
12.0
VAL-257
LEU-258
5.9
5.8
0.9
0.8
35.4
31.6
-1.5

Graph shows rotational transition at bending residues and can be used
to identify hinge bending residues.
Probably only informative for interdomain rotations greater than 20 degrees
Residue
iResidue
i+1Distance of hinge axis to residue i in
(A) Distance of hinge axis to residue i in
(A) Change in
(deg) Change in
(deg) Angle of psi(i) axis to hinge axis
(deg) Angle of psi(i) axis to hinge axis
(deg) Percentage Progress
LEU-265
ARG-266
13.8
13.6
0.6
-1.4
102.7
102.0
-1.3
ARG-266
PRO-267
16.8
16.6
1.8
-1.7
107.6
111.2
-5.1
PRO-267
GLY-268
17.5
17.1
6.2
-9.4
163.1
159.8
43.8
GLY-268
GLY-269
15.7
15.0
4.7
-3.6
91.8
91.0
-32.3
GLY-269
VAL-270
13.1
12.6
4.2
-0.6
92.3
87.4
-11.0
VAL-270
LEU-271
9.3
8.9
-2.6
3.7
126.6
128.8
-15.5
LEU-271
LEU-272
6.6
6.2
-6.1
4.1
59.9
59.0
-9.9
LEU-272
MET-273
3.8
3.8
-9.6
9.6
141.6
141.5
-7.5
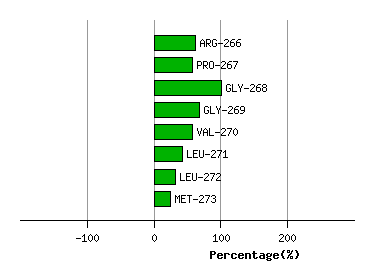
Graph shows rotational transition at bending residues and can be used
to identify hinge bending residues.
Probably only informative for interdomain rotations greater than 20 degrees
Residue
iResidue
i+1Distance of hinge axis to residue i in
(A) Distance of hinge axis to residue i in
(A) Change in
(deg) Change in
(deg) Angle of psi(i) axis to hinge axis
(deg) Angle of psi(i) axis to hinge axis
(deg) Percentage Progress
TYR-349
ILE-350
2.2
2.1
3.2
0.9
72.0
72.5
3.4
ILE-350
ALA-351
3.7
3.0
2.8
-7.7
113.6
113.2
12.6
ALA-351
ARG-352
6.7
6.1
7.7
-4.2
75.7
80.0
-0.9
ARG-352
LYS-353
10.0
9.4
3.6
-2.2
129.7
133.8
2.9

Graph shows rotational transition at bending residues and can be used
to identify hinge bending residues.
Probably only informative for interdomain rotations greater than 20 degrees