Set9
(All numbering and residues are taken from first PDB file)
![]()
![]()
Bending Residue Dihedral Analysis
Residue
iResidue
i+1Distance of hinge axis to residue i in
(A) Distance of hinge axis to residue i in
(A) Change in
(deg) Change in
(deg) Angle of psi(i) axis to hinge axis
(deg) Angle of psi(i) axis to hinge axis
(deg) Percentage Progress
GLN-83
GLY-84
9.0
9.1
-1.1
-3.9
128.5
128.9
3.2
GLY-84
THR-85
6.8
7.0
1.7
-2.2
34.6
32.3
84.5
THR-85
TYR-86
6.8
6.5
-9.5
-4.1
126.7
131.4
-182.4
TYR-86
VAL-87
6.4
6.3
3.7
1.9
19.8
21.2
101.9
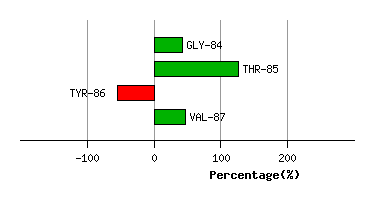
Graph shows rotational transition at bending residues and can be used
to identify hinge bending residues.
Probably only informative for interdomain rotations greater than 20 degrees
Residue
iResidue
i+1Distance of hinge axis to residue i in
(A) Distance of hinge axis to residue i in
(A) Change in
(deg) Change in
(deg) Angle of psi(i) axis to hinge axis
(deg) Angle of psi(i) axis to hinge axis
(deg) Percentage Progress
ASN-92
GLY-93
1.3
1.5
-2.2
3.7
72.3
70.3
-21.3
GLY-93
PRO-94
3.9
3.8
3.2
-10.3
165.5
171.0
52.6
PRO-94
ALA-95
5.4
5.1
22.6
-16.5
112.6
109.2
-46.4
ALA-95
GLN-96
4.4
4.4
-7.4
9.4
11.5
7.1
16.4

Graph shows rotational transition at bending residues and can be used
to identify hinge bending residues.
Probably only informative for interdomain rotations greater than 20 degrees
Residue
iResidue
i+1Distance of hinge axis to residue i in
(A) Distance of hinge axis to residue i in
(A) Change in
(deg) Change in
(deg) Angle of psi(i) axis to hinge axis
(deg) Angle of psi(i) axis to hinge axis
(deg) Percentage Progress
LEU-104
ILE-105
5.9
6.0
-5.5
11.6
78.0
78.7
43.5
ILE-105
PHE-106
3.1
3.2
-8.8
5.4
135.5
136.5
-20.1
PHE-106
LYS-107
1.4
1.5
4.2
-2.3
58.6
54.7
82.7
LYS-107
GLY-108
3.6
3.4
-13.1
18.8
53.0
54.8
-7.3
LYS-107
GLY-108
3.6
3.4
-13.1
18.8
53.0
54.8
-7.3

Graph shows rotational transition at bending residues and can be used
to identify hinge bending residues.
Probably only informative for interdomain rotations greater than 20 degrees
Residue
iResidue
i+1Distance of hinge axis to residue i in
(A) Distance of hinge axis to residue i in
(A) Change in
(deg) Change in
(deg) Angle of psi(i) axis to hinge axis
(deg) Angle of psi(i) axis to hinge axis
(deg) Percentage Progress
LYS-107
GLY-108
3.6
3.4
-13.1
18.8
53.0
54.8
-7.3
LYS-107
GLY-108
3.6
3.4
-13.1
18.8
53.0
54.8
-7.3
GLY-108
GLN-109
4.0
3.5
-6.6
6.5
19.6
21.2
17.7
GLN-109
TYR-110
2.6
2.4
-1.1
-0.6
64.8
68.5
65.4
TYR-110
LYS-111
1.2
1.4
-5.0
15.6
18.8
17.5
-102.7

Graph shows rotational transition at bending residues and can be used
to identify hinge bending residues.
Probably only informative for interdomain rotations greater than 20 degrees