Cadherin-23
(All numbering and residues are taken from first PDB file)
![]()
![]()
Bending Residue Dihedral Analysis
Residue
iResidue
i+1Distance of hinge axis to residue i in
(A) Distance of hinge axis to residue i in
(A) Change in
(deg) Change in
(deg) Angle of psi(i) axis to hinge axis
(deg) Angle of psi(i) axis to hinge axis
(deg) Percentage Progress
ALA-107
PRO-108
3.3
3.0
-5.3
2.5
76.1
76.5
6.3
PRO-108
THR-109
0.5
0.8
-4.4
2.8
10.6
10.6
-9.1
THR-109
PHE-110
2.2
2.4
1.3
-13.4
89.4
96.1
71.5
PHE-110
HIS-111
5.6
5.6
-22.6
8.0
54.0
35.8
169.5
HIS-111
ASN-112
8.5
7.6
23.1
-7.5
121.5
117.4
-115.1
ASN-112
GLN-113
11.0
10.2
9.2
-9.2
112.9
101.8
2.9
GLN-113
PRO-114
9.6
9.3
-1.9
-5.7
16.1
12.9
-45.9
PRO-114
TYR-115
11.0
11.1
-3.5
9.1
125.0
124.2
56.1
TYR-115
SER-116
13.7
13.6
0.6
10.2
110.0
103.5
-58.0
SER-116
VAL-117
17.2
17.3
3.0
-2.0
77.0
71.1
-7.2

Graph shows rotational transition at bending residues and can be used
to identify hinge bending residues.
Probably only informative for interdomain rotations greater than 20 degrees
Residue
iResidue
i+1Distance of hinge axis to residue i in
(A) Distance of hinge axis to residue i in
(A) Change in
(deg) Change in
(deg) Angle of psi(i) axis to hinge axis
(deg) Angle of psi(i) axis to hinge axis
(deg) Percentage Progress
VAL-132
ASN-133
12.6
12.6
-9.6
8.1
59.4
59.4
-34.9
ASN-133
ALA-134
10.0
10.0
-4.1
21.6
109.4
116.5
64.1
ALA-134
THR-135
6.3
6.3
-18.2
34.8
50.8
60.5
-49.6
THR-135
ASP-136
5.4
5.9
-16.8
9.0
90.8
74.9
66.3
ASP-136
PRO-137
3.8
4.2
-10.6
-1.1
65.9
69.0
45.5

Graph shows rotational transition at bending residues and can be used
to identify hinge bending residues.
Probably only informative for interdomain rotations greater than 20 degrees
Residue
iResidue
i+1Distance of hinge axis to residue i in
(A) Distance of hinge axis to residue i in
(A) Change in
(deg) Change in
(deg) Angle of psi(i) axis to hinge axis
(deg) Angle of psi(i) axis to hinge axis
(deg) Percentage Progress
GLY-140
ALA-141
5.8
6.3
-7.3
4.2
73.9
74.2
-15.7
ALA-141
GLY-142
2.2
2.5
-0.1
-8.1
20.6
18.9
59.3
GLY-142
GLY-143
3.5
3.5
2.5
1.7
134.7
135.0
-38.1
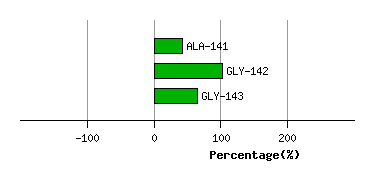
Graph shows rotational transition at bending residues and can be used
to identify hinge bending residues.
Probably only informative for interdomain rotations greater than 20 degrees
Residue
iResidue
i+1Distance of hinge axis to residue i in
(A) Distance of hinge axis to residue i in
(A) Change in
(deg) Change in
(deg) Angle of psi(i) axis to hinge axis
(deg) Angle of psi(i) axis to hinge axis
(deg) Percentage Progress
ASP-189
LYS-190
4.8
4.4
4.6
-13.9
123.8
121.0
21.5
LYS-190
THR-191
7.0
6.4
10.6
-3.8
68.7
73.4
30.6
THR-191
ARG-192
10.4
9.9
-21.3
20.6
165.3
165.8
-19.4

Graph shows rotational transition at bending residues and can be used
to identify hinge bending residues.
Probably only informative for interdomain rotations greater than 20 degrees
Residue
iResidue
i+1Distance of hinge axis to residue i in
(A) Distance of hinge axis to residue i in
(A) Change in
(deg) Change in
(deg) Angle of psi(i) axis to hinge axis
(deg) Angle of psi(i) axis to hinge axis
(deg) Percentage Progress
PRO-193
LEU-194
7.0
6.6
-2.5
4.8
10.7
10.4
-23.3
LEU-194
SER-195
6.3
5.7
0.2
-0.2
108.2
106.9
-1.1
SER-195
THR-196
5.9
5.6
-7.6
1.4
5.0
7.5
72.8

Graph shows rotational transition at bending residues and can be used
to identify hinge bending residues.
Probably only informative for interdomain rotations greater than 20 degrees