Avermectin-Sensitive Glutamate-Gated Chloride Channel Glucl Alpha
(All numbering and residues are taken from first PDB file)
![]()
![]()
Bending Residue Dihedral Analysis
Residue
iResidue
i+1Distance of hinge axis to residue i in
(A) Distance of hinge axis to residue i in
(A) Change in
(deg) Change in
(deg) Angle of psi(i) axis to hinge axis
(deg) Angle of psi(i) axis to hinge axis
(deg) Percentage Progress
TYR-221
ILE-222
8.1
7.9
-7.2
10.6
152.8
156.4
19.3
ILE-222
PRO-223
10.9
10.5
7.4
10.2
49.4
58.3
98.3
PRO-223
SER-224
11.2
11.0
-11.6
-1.0
110.3
118.6
-58.6
SER-224
CYS-225
7.7
7.6
8.4
2.7
50.7
46.0
63.6
CYS-225
MET-226
6.7
6.9
5.9
-0.5
24.0
28.0
41.2
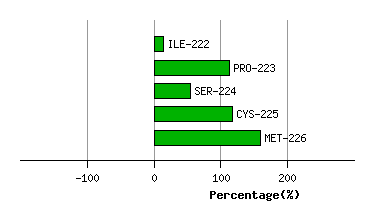
Graph shows rotational transition at bending residues and can be used
to identify hinge bending residues.
Probably only informative for interdomain rotations greater than 20 degrees
Residue
iResidue
i+1Distance of hinge axis to residue i in
(A) Distance of hinge axis to residue i in
(A) Change in
(deg) Change in
(deg) Angle of psi(i) axis to hinge axis
(deg) Angle of psi(i) axis to hinge axis
(deg) Percentage Progress
GLN-266
LEU-267
13.6
13.4
21.4
17.6
54.1
61.8
195.1
LEU-267
PRO-268
10.2
9.9
4.8
2.4
48.7
28.2
53.3
PRO-268
PRO-269
10.3
9.8
-8.8
8.2
76.9
89.9
-41.4

Graph shows rotational transition at bending residues and can be used
to identify hinge bending residues.
Probably only informative for interdomain rotations greater than 20 degrees
Residue
iResidue
i+1Distance of hinge axis to residue i in
(A) Distance of hinge axis to residue i in
(A) Change in
(deg) Change in
(deg) Angle of psi(i) axis to hinge axis
(deg) Angle of psi(i) axis to hinge axis
(deg) Percentage Progress
ILE-280
GLY-281
4.9
4.7
-1.9
1.7
125.2
123.0
8.2
GLY-281
ALA-282
6.4
6.4
4.8
2.5
32.8
36.6
54.3
ALA-282
CYS-283
4.1
4.1
0.2
-0.7
42.1
37.5
3.5
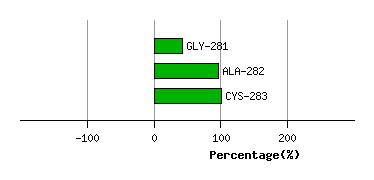
Graph shows rotational transition at bending residues and can be used
to identify hinge bending residues.
Probably only informative for interdomain rotations greater than 20 degrees
Residue
iResidue
i+1Distance of hinge axis to residue i in
(A) Distance of hinge axis to residue i in
(A) Change in
(deg) Change in
(deg) Angle of psi(i) axis to hinge axis
(deg) Angle of psi(i) axis to hinge axis
(deg) Percentage Progress
TYR-334
TRP-335
6.6
6.9
-2.5
11.3
125.2
128.5
60.0
TRP-335
SER-336
8.6
8.8
-11.8
10.9
118.3
121.2
-8.0
SER-336
ARG-337
11.6
11.7
-15.3
16.0
144.4
142.3
-7.0

Graph shows rotational transition at bending residues and can be used
to identify hinge bending residues.
Probably only informative for interdomain rotations greater than 20 degrees