Sugar Transport Protein
(All numbering and residues are taken from first PDB file)
![]()
![]()
Bending Residue Dihedral Analysis
Residue
iResidue
i+1Distance of hinge axis to residue i in
(A) Distance of hinge axis to residue i in
(A) Change in
(deg) Change in
(deg) Angle of psi(i) axis to hinge axis
(deg) Angle of psi(i) axis to hinge axis
(deg) Percentage Progress
GLN-130
GLY-131
3.6
3.8
7.6
1.3
73.1
74.4
9.2
GLY-131
THR-132
0.5
1.0
5.9
2.8
49.7
46.7
29.2
THR-132
PRO-133
2.6
3.0
-8.9
5.3
62.1
61.1
1.5
PRO-133
LYS-134
6.3
6.7
-0.6
4.7
75.9
75.7
-3.9
LYS-134
GLN-135
7.5
7.8
-5.5
1.3
37.0
33.0
13.8

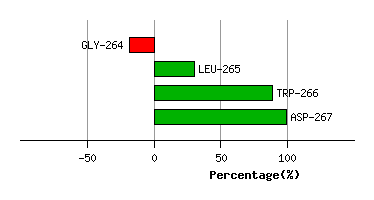
Graph shows rotational transition at bending residues and can be used
to identify hinge bending residues.
Probably only informative for interdomain rotations greater than 20 degrees
Residue
iResidue
i+1Distance of hinge axis to residue i in
(A) Distance of hinge axis to residue i in
(A) Change in
(deg) Change in
(deg) Angle of psi(i) axis to hinge axis
(deg) Angle of psi(i) axis to hinge axis
(deg) Percentage Progress
PHE-263
GLY-264
5.5
5.4
9.5
2.6
127.1
129.3
-24.0
GLY-264
LEU-265
3.2
3.3
-13.8
15.0
71.0
77.7
48.8
LEU-265
TRP-266
2.0
2.1
0.1
-13.0
113.5
120.9
58.7
TRP-266
ASP-267
3.2
3.3
-1.1
1.6
118.8
112.8
10.4
Graph shows rotational transition at bending residues and can be used
to identify hinge bending residues.
Probably only informative for interdomain rotations greater than 20 degrees
Residue
iResidue
i+1Distance of hinge axis to residue i in
(A) Distance of hinge axis to residue i in
(A) Change in
(deg) Change in
(deg) Angle of psi(i) axis to hinge axis
(deg) Angle of psi(i) axis to hinge axis
(deg) Percentage Progress
ARG-327
VAL-328
3.4
3.0
-15.8
-2.3
22.5
30.8
62.8
VAL-328
ILE-329
3.4
3.3
-1.3
9.3
62.3
62.0
1.6
ILE-329
PHE-330
4.3
4.2
6.0
-4.6
159.6
157.5
-10.3

Graph shows rotational transition at bending residues and can be used
to identify hinge bending residues.
Probably only informative for interdomain rotations greater than 20 degrees