Putative Iron Compound-Binding Protein Of Abc Transporter Family
(All numbering and residues are taken from first PDB file)
![]()
![]()
Bending Residue Dihedral Analysis
Residue
iResidue
i+1Distance of hinge axis to residue i in
(A) Distance of hinge axis to residue i in
(A) Change in
(deg) Change in
(deg) Angle of psi(i) axis to hinge axis
(deg) Angle of psi(i) axis to hinge axis
(deg) Percentage Progress
VAL-23
PHE-24
8.3
8.7
-5.0
-1.9
56.3
52.2
140.7
PHE-24
THR-25
9.1
9.5
-9.8
5.6
83.7
82.1
31.5
THR-25
ASP-26
12.6
13.0
7.1
-7.2
160.4
160.9
-64.4

Graph shows rotational transition at bending residues and can be used
to identify hinge bending residues.
Probably only informative for interdomain rotations greater than 20 degrees
Residue
iResidue
i+1Distance of hinge axis to residue i in
(A) Distance of hinge axis to residue i in
(A) Change in
(deg) Change in
(deg) Angle of psi(i) axis to hinge axis
(deg) Angle of psi(i) axis to hinge axis
(deg) Percentage Progress
VAL-32
THR-33
12.8
13.1
-5.1
-3.2
68.4
64.5
76.8
THR-33
VAL-34
11.1
11.4
4.3
6.2
35.9
40.4
199.6
VAL-34
PRO-35
9.0
9.1
3.9
-5.1
105.0
105.8
-15.3
PRO-35
ALA-36
7.6
8.1
1.0
-8.7
97.4
101.3
-129.7
ALA-36
HIS-37
4.4
5.1
3.0
-0.1
30.6
37.3
35.7
HIS-37
PRO-38
5.3
5.8
-6.3
6.9
128.0
136.7
-7.6

Graph shows rotational transition at bending residues and can be used
to identify hinge bending residues.
Probably only informative for interdomain rotations greater than 20 degrees
Residue
iResidue
i+1Distance of hinge axis to residue i in
(A) Distance of hinge axis to residue i in
(A) Change in
(deg) Change in
(deg) Angle of psi(i) axis to hinge axis
(deg) Angle of psi(i) axis to hinge axis
(deg) Percentage Progress
SER-63
HIS-64
9.1
8.9
0.1
0.3
45.8
44.8
16.3
HIS-64
GLY-65
10.8
10.6
-0.8
2.8
138.1
136.8
-79.6
GLY-65
ARG-66
9.4
9.2
-5.2
17.5
143.1
138.7
187.1
ARG-66
THR-67
10.1
10.1
0.6
-6.2
43.5
49.6
-180.4
THR-67
ARG-68
11.6
11.7
2.2
-8.2
25.8
24.3
-182.7
ARG-68
PRO-69
10.3
11.1
-1.2
-6.3
124.0
117.4
34.8
PRO-69
ASP-70
12.7
13.9
7.0
-1.7
79.3
74.2
30.1
ASP-70
GLY-71
12.4
13.0
-0.5
2.6
38.5
36.1
-7.8
GLY-71
SER-72
13.9
13.9
-5.3
16.1
48.5
56.2
-150.6
SER-72
HIS-73
11.1
10.6
-10.9
-3.7
48.0
41.9
353.5
HIS-73
PHE-74
9.5
9.4
-2.5
1.5
78.3
76.4
104.3
PHE-74
ILE-75
6.0
6.0
5.5
-1.4
141.3
144.0
-47.3

Graph shows rotational transition at bending residues and can be used
to identify hinge bending residues.
Probably only informative for interdomain rotations greater than 20 degrees
Residue
iResidue
i+1Distance of hinge axis to residue i in
(A) Distance of hinge axis to residue i in
(A) Change in
(deg) Change in
(deg) Angle of psi(i) axis to hinge axis
(deg) Angle of psi(i) axis to hinge axis
(deg) Percentage Progress
THR-82
GLY-83
5.2
5.3
1.9
1.5
112.4
112.0
5.2
GLY-83
VAL-84
5.8
5.9
2.7
-2.2
77.3
78.6
21.6
VAL-84
ASP-85
4.3
4.3
-1.8
0.4
62.5
60.1
7.0

Graph shows rotational transition at bending residues and can be used
to identify hinge bending residues.
Probably only informative for interdomain rotations greater than 20 degrees
Residue
iResidue
i+1Distance of hinge axis to residue i in
(A) Distance of hinge axis to residue i in
(A) Change in
(deg) Change in
(deg) Angle of psi(i) axis to hinge axis
(deg) Angle of psi(i) axis to hinge axis
(deg) Percentage Progress
ILE-113
THR-114
10.3
10.3
5.5
0.2
41.2
39.8
42.3
THR-114
GLU-115
13.0
13.1
-1.7
-4.0
82.1
86.6
33.6
GLU-115
PRO-116
14.8
14.8
0.8
-3.9
78.2
73.8
-9.3
PRO-116
THR-117
18.6
18.6
10.6
2.9
157.7
156.8
-290.0
PRO-116
THR-117
18.6
18.6
10.6
2.9
157.7
156.8
-290.0

Graph shows rotational transition at bending residues and can be used
to identify hinge bending residues.
Probably only informative for interdomain rotations greater than 20 degrees
Residue
iResidue
i+1Distance of hinge axis to residue i in
(A) Distance of hinge axis to residue i in
(A) Change in
(deg) Change in
(deg) Angle of psi(i) axis to hinge axis
(deg) Angle of psi(i) axis to hinge axis
(deg) Percentage Progress
PRO-116
THR-117
18.6
18.6
10.6
2.9
157.7
156.8
-290.0
PRO-116
THR-117
18.6
18.6
10.6
2.9
157.7
156.8
-290.0
THR-117
ARG-118
19.0
18.9
-4.5
1.0
64.6
70.8
230.3
ARG-118
ASN-119
17.8
18.2
13.8
-13.6
71.3
75.9
169.3
ASN-119
THR-120
21.0
21.4
16.0
-13.9
62.4
63.3
45.3

Graph shows rotational transition at bending residues and can be used
to identify hinge bending residues.
Probably only informative for interdomain rotations greater than 20 degrees
Residue
iResidue
i+1Distance of hinge axis to residue i in
(A) Distance of hinge axis to residue i in
(A) Change in
(deg) Change in
(deg) Angle of psi(i) axis to hinge axis
(deg) Angle of psi(i) axis to hinge axis
(deg) Percentage Progress
PRO-130
THR-131
13.8
13.8
1.7
0.2
38.2
37.3
52.6
THR-131
VAL-132
13.8
13.9
-5.1
0.4
70.6
73.4
99.2
VAL-132
SER-133
12.6
12.6
-2.0
4.8
144.0
144.9
40.0
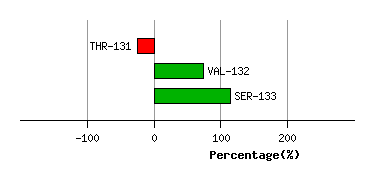
Graph shows rotational transition at bending residues and can be used
to identify hinge bending residues.
Probably only informative for interdomain rotations greater than 20 degrees
Residue
iResidue
i+1Distance of hinge axis to residue i in
(A) Distance of hinge axis to residue i in
(A) Change in
(deg) Change in
(deg) Angle of psi(i) axis to hinge axis
(deg) Angle of psi(i) axis to hinge axis
(deg) Percentage Progress
ILE-134
ASP-135
13.2
12.9
-9.0
5.8
46.8
44.9
54.1
ASP-135
HIS-136
15.9
15.6
3.8
-7.4
101.2
102.8
-8.0
HIS-136
LEU-137
15.7
15.3
5.3
-5.0
80.3
86.8
39.0

Graph shows rotational transition at bending residues and can be used
to identify hinge bending residues.
Probably only informative for interdomain rotations greater than 20 degrees
Residue
iResidue
i+1Distance of hinge axis to residue i in
(A) Distance of hinge axis to residue i in
(A) Change in
(deg) Change in
(deg) Angle of psi(i) axis to hinge axis
(deg) Angle of psi(i) axis to hinge axis
(deg) Percentage Progress
LYS-147
LEU-148
8.2
8.4
-3.2
2.7
108.6
104.7
1.1
LEU-148
ALA-149
5.2
5.3
0.0
1.2
118.8
120.0
-14.7
ALA-149
GLU-150
4.1
4.3
4.6
-10.8
156.4
157.6
63.1

Graph shows rotational transition at bending residues and can be used
to identify hinge bending residues.
Probably only informative for interdomain rotations greater than 20 degrees
Residue
iResidue
i+1Distance of hinge axis to residue i in
(A) Distance of hinge axis to residue i in
(A) Change in
(deg) Change in
(deg) Angle of psi(i) axis to hinge axis
(deg) Angle of psi(i) axis to hinge axis
(deg) Percentage Progress
ALA-287
ILE-288
15.1
15.4
-5.9
0.1
127.8
129.3
-32.9
ILE-288
SER-289
14.3
14.6
20.2
-5.4
41.8
46.8
352.1
SER-289
ASN-290
11.1
11.5
1.6
1.1
31.5
19.9
-106.2

Graph shows rotational transition at bending residues and can be used
to identify hinge bending residues.
Probably only informative for interdomain rotations greater than 20 degrees
Residue
iResidue
i+1Distance of hinge axis to residue i in
(A) Distance of hinge axis to residue i in
(A) Change in
(deg) Change in
(deg) Angle of psi(i) axis to hinge axis
(deg) Angle of psi(i) axis to hinge axis
(deg) Percentage Progress
SER-291
PHE-292
9.6
9.7
-4.3
1.0
81.9
77.5
51.3
PHE-292
ALA-293
11.4
11.6
-1.4
-2.0
148.7
145.6
-62.8
ALA-293
SER-294
10.9
11.2
4.6
-1.4
57.2
55.9
65.3
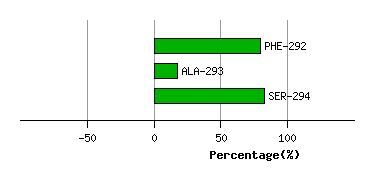
Graph shows rotational transition at bending residues and can be used
to identify hinge bending residues.
Probably only informative for interdomain rotations greater than 20 degrees