Dihydroflavonol 4-Reductase
(All numbering and residues are taken from first PDB file)
![]()
![]()
Bending Residue Dihedral Analysis
Residue
iResidue
i+1Distance of hinge axis to residue i in
(A) Distance of hinge axis to residue i in
(A) Change in
(deg) Change in
(deg) Angle of psi(i) axis to hinge axis
(deg) Angle of psi(i) axis to hinge axis
(deg) Percentage Progress
PHE-82
HIS-83
2.6
2.5
1.0
-0.6
81.3
83.6
37.9
HIS-83
VAL-84
2.2
2.3
-2.9
0.5
44.4
46.4
21.9
VAL-84
ALA-85
5.4
5.5
-2.0
2.4
95.5
96.9
29.4
ALA-85
THR-86
8.1
8.2
-3.1
-7.9
55.8
53.1
135.1
THR-86
PRO-87
10.5
10.7
5.7
-8.0
79.4
85.4
-39.4
PRO-87
MET-88
14.3
14.5
35.6
32.6
142.8
154.3
-1773.5
MET-88
ASP-89
15.8
16.0
-28.3
11.7
107.7
71.6
187.5
ASP-89
PHE-90
18.6
19.6
169.5
39.1
115.0
156.3
4185.9
PHE-90
GLU-91
21.8
20.5
-166.8
-57.9
37.4
87.6
-1755.2
GLU-91
SER-92
23.5
24.1
-97.9
56.2
125.0
138.7
-880.9
SER-92
LYS-93
24.0
23.8
10.1
-13.3
120.5
107.5
138.9
LYS-93
ASP-94
27.2
27.1
2.4
-9.2
85.0
82.7
-202.1
ASP-94
PRO-95
25.3
25.4
2.3
0.1
98.4
98.8
-104.2
PRO-95
GLU-96
22.0
22.0
8.7
-11.1
73.5
74.5
132.1
GLU-96
ASN-97
21.8
21.9
4.9
-7.6
17.7
18.8
-182.3
ASN-97
GLU-98
21.8
21.8
-1.5
6.1
110.7
110.0
43.9

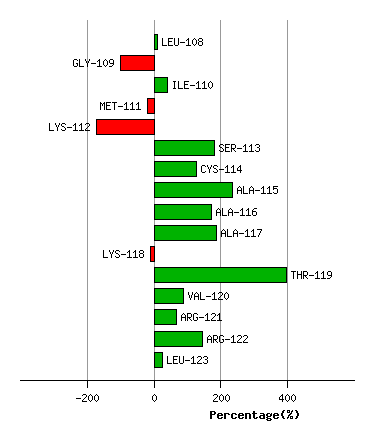
Graph shows rotational transition at bending residues and can be used
to identify hinge bending residues.
Probably only informative for interdomain rotations greater than 20 degrees
Residue
iResidue
i+1Distance of hinge axis to residue i in
(A) Distance of hinge axis to residue i in
(A) Change in
(deg) Change in
(deg) Angle of psi(i) axis to hinge axis
(deg) Angle of psi(i) axis to hinge axis
(deg) Percentage Progress
MET-107
LEU-108
8.6
8.7
-0.5
-0.9
68.7
69.4
24.4
LEU-108
GLY-109
11.0
11.2
7.5
-2.6
166.4
166.9
-110.8
GLY-109
ILE-110
10.6
10.6
-5.9
2.7
75.0
79.3
141.4
ILE-110
MET-111
6.9
6.9
-1.6
4.3
103.6
105.4
-59.9
MET-111
LYS-112
8.4
8.6
-1.5
7.3
44.0
45.0
-153.3
LYS-112
SER-113
11.0
11.1
2.1
-13.8
139.8
135.7
354.0
SER-113
CYS-114
8.1
8.3
10.0
-7.1
80.9
75.1
-54.0
CYS-114
ALA-115
7.8
7.9
4.1
-3.5
100.9
95.7
106.3
ALA-115
ALA-116
11.6
11.7
20.5
-20.8
169.6
160.6
-61.5
ALA-116
ALA-117
11.6
11.8
-1.7
-8.4
63.8
69.8
15.7
ALA-117
LYS-118
9.3
9.6
108.1
-123.8
89.3
62.5
-199.1
LYS-118
THR-119
12.5
12.9
1.7
32.1
71.3
75.3
409.6
THR-119
VAL-120
11.3
11.7
-18.3
8.7
149.7
153.6
-310.0
VAL-120
ARG-121
9.4
9.4
-4.6
-0.6
138.4
141.2
-22.1
ARG-121
ARG-122
11.7
11.6
6.7
-4.2
28.9
31.3
78.8
ARG-122
LEU-123
9.0
8.8
-1.3
1.8
81.7
80.6
-121.2
Graph shows rotational transition at bending residues and can be used
to identify hinge bending residues.
Probably only informative for interdomain rotations greater than 20 degrees
Residue
iResidue
i+1Distance of hinge axis to residue i in
(A) Distance of hinge axis to residue i in
(A) Change in
(deg) Change in
(deg) Angle of psi(i) axis to hinge axis
(deg) Angle of psi(i) axis to hinge axis
(deg) Percentage Progress
SER-127
SER-128
4.1
4.2
6.9
-10.6
120.1
118.8
30.2
SER-128
ALA-129
6.4
6.4
6.0
-2.2
167.4
165.4
-31.9
ALA-129
GLY-130
6.6
6.7
-2.7
9.0
76.2
77.1
-25.0

Graph shows rotational transition at bending residues and can be used
to identify hinge bending residues.
Probably only informative for interdomain rotations greater than 20 degrees
Residue
iResidue
i+1Distance of hinge axis to residue i in
(A) Distance of hinge axis to residue i in
(A) Change in
(deg) Change in
(deg) Angle of psi(i) axis to hinge axis
(deg) Angle of psi(i) axis to hinge axis
(deg) Percentage Progress
GLU-136
HIS-137
15.0
15.0
-2.1
1.1
135.1
133.3
-8.7
HIS-137
GLN-138
12.1
12.1
1.8
1.5
117.4
118.6
-75.6
GLN-138
LEU-139
9.3
9.3
7.8
-8.1
53.3
54.0
75.1
LEU-139
PRO-140
5.7
5.6
5.6
2.7
90.8
90.4
43.5
LEU-139
PRO-140
5.7
5.6
5.6
2.7
90.8
90.4
43.5
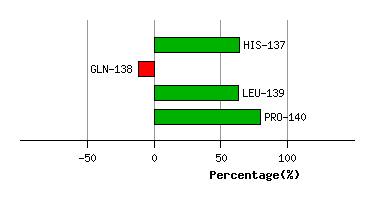
Graph shows rotational transition at bending residues and can be used
to identify hinge bending residues.
Probably only informative for interdomain rotations greater than 20 degrees
Residue
iResidue
i+1Distance of hinge axis to residue i in
(A) Distance of hinge axis to residue i in
(A) Change in
(deg) Change in
(deg) Angle of psi(i) axis to hinge axis
(deg) Angle of psi(i) axis to hinge axis
(deg) Percentage Progress
LEU-139
PRO-140
5.7
5.6
5.6
2.7
90.8
90.4
43.5
LEU-139
PRO-140
5.7
5.6
5.6
2.7
90.8
90.4
43.5
PRO-140
VAL-141
4.6
4.7
-7.1
3.4
139.5
144.0
-129.1
VAL-141
TYR-142
2.6
2.7
-5.2
9.2
128.5
127.6
78.3

Graph shows rotational transition at bending residues and can be used
to identify hinge bending residues.
Probably only informative for interdomain rotations greater than 20 degrees
Residue
iResidue
i+1Distance of hinge axis to residue i in
(A) Distance of hinge axis to residue i in
(A) Change in
(deg) Change in
(deg) Angle of psi(i) axis to hinge axis
(deg) Angle of psi(i) axis to hinge axis
(deg) Percentage Progress
ASP-184
PHE-185
11.3
11.2
-0.5
-9.5
97.6
96.0
-72.7
PHE-185
ILE-186
8.1
8.0
-4.9
9.4
146.8
147.1
65.4
ILE-186
THR-187
5.9
5.8
5.5
-6.3
85.0
83.9
-33.5

Graph shows rotational transition at bending residues and can be used
to identify hinge bending residues.
Probably only informative for interdomain rotations greater than 20 degrees