Homoserine Dehydrogenase
(All numbering and residues are taken from first PDB file)
![]()
![]()
Bending Residue Dihedral Analysis
Residue
iResidue
i+1Distance of hinge axis to residue i in
(A) Distance of hinge axis to residue i in
(A) Change in
(deg) Change in
(deg) Angle of psi(i) axis to hinge axis
(deg) Angle of psi(i) axis to hinge axis
(deg) Percentage Progress
GLY-171
ILE-172
0.6
0.8
10.5
1.8
16.2
14.8
155.0
ILE-172
PHE-173
2.7
2.7
14.1
-8.6
94.4
95.5
14.1
PHE-173
SER-174
4.9
4.8
-15.6
14.4
144.3
141.1
9.4

Graph shows rotational transition at bending residues and can be used
to identify hinge bending residues.
Probably only informative for interdomain rotations greater than 20 degrees
Residue
iResidue
i+1Distance of hinge axis to residue i in
(A) Distance of hinge axis to residue i in
(A) Change in
(deg) Change in
(deg) Angle of psi(i) axis to hinge axis
(deg) Angle of psi(i) axis to hinge axis
(deg) Percentage Progress
LEU-218
ASP-219
9.2
8.8
2.8
-5.0
37.9
36.9
-68.8
ASP-219
VAL-220
9.0
8.8
6.8
-0.5
34.7
31.5
95.3
VAL-220
ALA-221
6.2
6.1
0.6
2.8
70.9
71.1
55.6

Graph shows rotational transition at bending residues and can be used
to identify hinge bending residues.
Probably only informative for interdomain rotations greater than 20 degrees
Residue
iResidue
i+1Distance of hinge axis to residue i in
(A) Distance of hinge axis to residue i in
(A) Change in
(deg) Change in
(deg) Angle of psi(i) axis to hinge axis
(deg) Angle of psi(i) axis to hinge axis
(deg) Percentage Progress
PHE-241
PRO-242
14.3
14.1
-11.5
15.5
135.6
131.1
-4.7
PRO-242
VAL-243
12.2
12.1
0.4
-8.0
88.3
86.0
-29.7
VAL-243
GLN-244
9.0
8.9
8.2
-4.1
34.1
33.8
53.7

Graph shows rotational transition at bending residues and can be used
to identify hinge bending residues.
Probably only informative for interdomain rotations greater than 20 degrees
Residue
iResidue
i+1Distance of hinge axis to residue i in
(A) Distance of hinge axis to residue i in
(A) Change in
(deg) Change in
(deg) Angle of psi(i) axis to hinge axis
(deg) Angle of psi(i) axis to hinge axis
(deg) Percentage Progress
PHE-287
ILE-288
2.8
2.8
5.2
-3.6
30.5
29.3
21.2
ILE-288
GLY-289
2.1
2.0
1.5
1.6
86.1
84.1
13.5
GLY-289
LYS-290
3.7
3.6
10.3
-9.4
35.9
37.6
26.6
LYS-290
VAL-291
6.1
6.2
-4.2
-2.9
115.4
112.8
-42.8
VAL-291
ASP-292
8.5
8.6
-2.7
6.3
130.8
136.6
35.1

Graph shows rotational transition at bending residues and can be used
to identify hinge bending residues.
Probably only informative for interdomain rotations greater than 20 degrees
Residue
iResidue
i+1Distance of hinge axis to residue i in
(A) Distance of hinge axis to residue i in
(A) Change in
(deg) Change in
(deg) Angle of psi(i) axis to hinge axis
(deg) Angle of psi(i) axis to hinge axis
(deg) Percentage Progress
SER-299
VAL-300
9.3
9.2
3.1
-3.4
75.3
80.6
-25.2
VAL-300
GLY-301
6.2
6.0
14.1
-1.3
43.6
39.1
130.0
GLY-301
ILE-302
5.2
5.2
-2.9
2.8
75.7
74.8
63.0

Graph shows rotational transition at bending residues and can be used
to identify hinge bending residues.
Probably only informative for interdomain rotations greater than 20 degrees
Residue
iResidue
i+1Distance of hinge axis to residue i in
(A) Distance of hinge axis to residue i in
(A) Change in
(deg) Change in
(deg) Angle of psi(i) axis to hinge axis
(deg) Angle of psi(i) axis to hinge axis
(deg) Percentage Progress
ALA-312
SER-313
12.0
11.9
13.1
7.8
85.9
78.6
38.3
SER-313
LEU-314
13.8
13.3
-21.9
-3.3
91.8
74.8
13.1
LEU-314
LYS-315
11.9
11.6
14.6
-31.6
118.3
132.0
79.3
LYS-315
GLY-316
14.7
14.2
2.5
-18.1
128.5
123.7
149.9
GLY-316
SER-317
14.9
13.9
-6.5
49.4
107.4
84.4
40.6
GLY-316
SER-317
14.9
13.9
-6.5
49.4
107.4
84.4
40.6
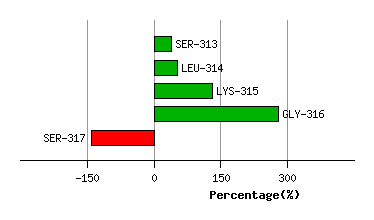
Graph shows rotational transition at bending residues and can be used
to identify hinge bending residues.
Probably only informative for interdomain rotations greater than 20 degrees
Residue
iResidue
i+1Distance of hinge axis to residue i in
(A) Distance of hinge axis to residue i in
(A) Change in
(deg) Change in
(deg) Angle of psi(i) axis to hinge axis
(deg) Angle of psi(i) axis to hinge axis
(deg) Percentage Progress
GLY-316
SER-317
14.9
13.9
-6.5
49.4
107.4
84.4
40.6
GLY-316
SER-317
14.9
13.9
-6.5
49.4
107.4
84.4
40.6
SER-317
ASP-318
11.7
12.0
-21.9
-3.8
36.9
26.1
273.7
ASP-318
ASN-319
10.8
10.9
-5.9
-38.6
91.0
92.7
132.6
ASN-319
VAL-320
7.5
7.3
1.0
13.6
148.7
163.4
-216.8
VAL-320
ILE-321
5.5
5.3
15.4
-3.7
76.0
75.5
10.0
VAL-320
ILE-321
5.5
5.3
15.4
-3.7
76.0
75.5
10.0
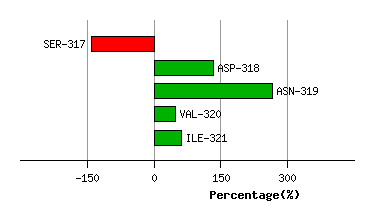
Graph shows rotational transition at bending residues and can be used
to identify hinge bending residues.
Probably only informative for interdomain rotations greater than 20 degrees
Residue
iResidue
i+1Distance of hinge axis to residue i in
(A) Distance of hinge axis to residue i in
(A) Change in
(deg) Change in
(deg) Angle of psi(i) axis to hinge axis
(deg) Angle of psi(i) axis to hinge axis
(deg) Percentage Progress
VAL-320
ILE-321
5.5
5.3
15.4
-3.7
76.0
75.5
10.0
VAL-320
ILE-321
5.5
5.3
15.4
-3.7
76.0
75.5
10.0
ILE-321
SER-322
2.5
2.4
-1.8
0.5
139.1
141.2
-27.0
SER-322
ILE-323
2.1
2.0
-5.2
8.2
115.9
118.6
36.9

Graph shows rotational transition at bending residues and can be used
to identify hinge bending residues.
Probably only informative for interdomain rotations greater than 20 degrees