3-Phosphoglycerate Kinase
(All numbering and residues are taken from first PDB file)
![]()
![]()
Bending Residue Dihedral Analysis
Residue
iResidue
i+1Distance of hinge axis to residue i in
(A) Distance of hinge axis to residue i in
(A) Change in
(deg) Change in
(deg) Angle of psi(i) axis to hinge axis
(deg) Angle of psi(i) axis to hinge axis
(deg) Percentage Progress
ALA-201
LYS-202
6.0
6.8
40.5
-17.4
66.2
64.7
34.9
LYS-202
VAL-203
8.7
9.3
-10.9
9.2
121.8
87.0
-24.0
VAL-203
LEU-204
9.2
10.0
-2.2
-17.3
62.5
24.4
29.8

Graph shows rotational transition at bending residues and can be used
to identify hinge bending residues.
Probably only informative for interdomain rotations greater than 20 degrees
Residue
iResidue
i+1Distance of hinge axis to residue i in
(A) Distance of hinge axis to residue i in
(A) Change in
(deg) Change in
(deg) Angle of psi(i) axis to hinge axis
(deg) Angle of psi(i) axis to hinge axis
(deg) Percentage Progress
ALA-388
LYS-389
2.9
1.7
9.1
-20.0
81.0
87.3
4.3
LYS-389
ARG-390
0.9
2.4
27.8
-22.1
88.2
103.6
11.6
ARG-390
MET-391
3.6
3.4
-4.2
-38.3
145.4
137.7
-150.2

Graph shows rotational transition at bending residues and can be used
to identify hinge bending residues.
Probably only informative for interdomain rotations greater than 20 degrees
Residue
iResidue
i+1Distance of hinge axis to residue i in
(A) Distance of hinge axis to residue i in
(A) Change in
(deg) Change in
(deg) Angle of psi(i) axis to hinge axis
(deg) Angle of psi(i) axis to hinge axis
(deg) Percentage Progress
HIS-393
VAL-394
2.2
2.2
-3.2
0.4
100.3
98.3
-13.0
VAL-394
SER-395
3.1
2.6
12.3
7.2
141.9
141.9
-57.3
SER-395
THR-396
4.5
4.2
-6.0
-2.9
92.8
100.3
-21.2
THR-396
GLY-397
7.5
7.0
-7.1
-23.4
51.7
55.3
41.9
GLY-397
GLY-398
8.4
8.7
-21.7
44.6
114.4
85.2
6.9
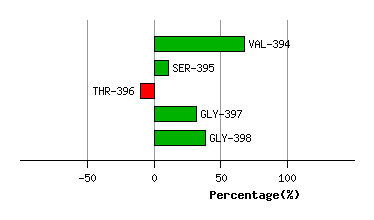
Graph shows rotational transition at bending residues and can be used
to identify hinge bending residues.
Probably only informative for interdomain rotations greater than 20 degrees