Vitamin B12 Transport Protein Btuf
(All numbering and residues are taken from first PDB file)
![]()
![]()
Bending Residue Dihedral Analysis
Residue
iResidue
i+1Distance of hinge axis to residue i in
(A) Distance of hinge axis to residue i in
(A) Change in
(deg) Change in
(deg) Angle of psi(i) axis to hinge axis
(deg) Angle of psi(i) axis to hinge axis
(deg) Percentage Progress
GLN-149
TYR-150
13.5
14.0
11.8
-19.2
88.9
94.0
-34.1
TYR-150
ALA-151
11.8
12.3
16.2
-41.3
146.9
157.7
258.0
ALA-151
ASP-152
13.6
13.7
37.4
-2.3
88.7
91.0
-50.2
ASP-152
LYS-153
16.7
17.0
-29.5
28.3
126.3
115.0
-14.6
LYS-153
PRO-154
15.2
16.0
22.6
-21.9
122.1
131.7
-15.7
PRO-154
LYS-155
16.7
17.8
-115.9
136.4
87.2
72.5
-94.7
LYS-155
LYS-156
14.4
14.6
-57.5
48.3
117.6
116.6
-6.6
LYS-156
ARG-157
14.2
14.3
-5.4
-0.6
60.1
60.7
29.5
ARG-157
VAL-158
14.6
14.5
7.5
-3.4
55.6
52.8
13.1

Graph shows rotational transition at bending residues and can be used
to identify hinge bending residues.
Probably only informative for interdomain rotations greater than 20 degrees
Residue
iResidue
i+1Distance of hinge axis to residue i in
(A) Distance of hinge axis to residue i in
(A) Change in
(deg) Change in
(deg) Angle of psi(i) axis to hinge axis
(deg) Angle of psi(i) axis to hinge axis
(deg) Percentage Progress
THR-240
SER-241
7.5
6.8
5.9
-14.3
27.3
27.1
-48.2
SER-241
ASP-242
10.2
9.5
11.4
-5.0
53.7
63.2
39.8
ASP-242
TRP-243
11.2
10.6
11.0
-14.6
65.7
65.1
13.7
TRP-243
PHE-244
7.9
7.4
0.9
-3.4
40.7
37.0
-2.9
PHE-244
GLU-245
6.2
5.7
9.1
-13.5
39.2
40.9
-6.3

Graph shows rotational transition at bending residues and can be used
to identify hinge bending residues.
Probably only informative for interdomain rotations greater than 20 degrees
Residue
iResidue
i+1Distance of hinge axis to residue i in
(A) Distance of hinge axis to residue i in
(A) Change in
(deg) Change in
(deg) Angle of psi(i) axis to hinge axis
(deg) Angle of psi(i) axis to hinge axis
(deg) Percentage Progress
ILE-251
ILE-252
6.4
6.1
-0.6
-2.3
112.5
110.0
-11.7
ILE-252
LEU-253
6.6
6.4
3.5
6.5
19.2
13.5
69.7
LEU-253
ALA-254
5.9
5.9
-8.4
3.1
91.4
94.0
10.4
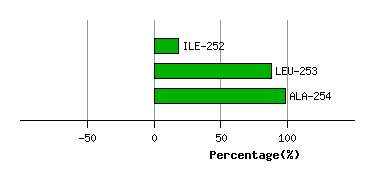
Graph shows rotational transition at bending residues and can be used
to identify hinge bending residues.
Probably only informative for interdomain rotations greater than 20 degrees