Glutamate Receptor, Ionotropic Kainate 3
(All numbering and residues are taken from first PDB file)
![]()
![]()
Bending Residue Dihedral Analysis
Residue
iResidue
i+1Distance of hinge axis to residue i in
(A) Distance of hinge axis to residue i in
(A) Change in
(deg) Change in
(deg) Angle of psi(i) axis to hinge axis
(deg) Angle of psi(i) axis to hinge axis
(deg) Percentage Progress
THR-107
LEU-108
2.1
2.5
13.5
-14.1
38.1
40.5
-7.4
LEU-108
GLY-109
1.2
1.1
7.9
-30.2
118.4
114.2
54.1
GLY-109
VAL-110
4.8
4.7
8.3
5.0
39.0
40.8
26.4
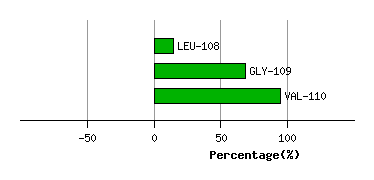
Graph shows rotational transition at bending residues and can be used
to identify hinge bending residues.
Probably only informative for interdomain rotations greater than 20 degrees
Residue
iResidue
i+1Distance of hinge axis to residue i in
(A) Distance of hinge axis to residue i in
(A) Change in
(deg) Change in
(deg) Angle of psi(i) axis to hinge axis
(deg) Angle of psi(i) axis to hinge axis
(deg) Percentage Progress
ASP-211
SER-212
8.4
7.9
-4.1
18.0
84.1
87.8
-13.8
SER-212
LYS-213
4.6
4.2
-1.5
23.9
110.4
92.3
38.4
LYS-213
GLY-214
3.6
3.4
-27.1
-1.3
59.8
79.6
33.1
GLY-214
TYR-215
4.2
3.7
-16.4
-2.2
63.7
68.0
5.5

Graph shows rotational transition at bending residues and can be used
to identify hinge bending residues.
Probably only informative for interdomain rotations greater than 20 degrees
Residue
iResidue
i+1Distance of hinge axis to residue i in
(A) Distance of hinge axis to residue i in
(A) Change in
(deg) Change in
(deg) Angle of psi(i) axis to hinge axis
(deg) Angle of psi(i) axis to hinge axis
(deg) Percentage Progress
LYS-248
TRP-249
13.3
13.5
-7.7
11.3
126.0
127.0
-5.6
TRP-249
TRP-250
10.2
10.3
-3.0
-6.6
99.2
103.9
3.4
TRP-250
ARG-251
7.8
8.1
-16.2
-30.9
125.7
118.5
-112.8
ARG-251
GLY-252
10.5
11.2
148.8
65.6
9.4
52.9
405.3
GLY-252
SER-253
11.5
14.0
-4.2
-127.3
130.4
150.4
-492.9
SER-253
GLY-254
10.3
11.6
134.9
170.2
97.4
72.7
47.2

Graph shows rotational transition at bending residues and can be used
to identify hinge bending residues.
Probably only informative for interdomain rotations greater than 20 degrees