Capsid Protein
(All numbering and residues are taken from first PDB file)
![]()
![]()
Bending Residue Dihedral Analysis
Residue
iResidue
i+1Distance of hinge axis to residue i in
(A) Distance of hinge axis to residue i in
(A) Change in
(deg) Change in
(deg) Angle of psi(i) axis to hinge axis
(deg) Angle of psi(i) axis to hinge axis
(deg) Percentage Progress
ILE-207
ASN-208
19.7
18.9
10.0
18.7
60.1
51.8
178.3
ASN-208
TRP-209
22.4
21.5
42.6
-34.4
28.3
33.9
75.7
TRP-209
SER-210
22.1
21.4
-1.2
7.3
128.9
134.2
39.6
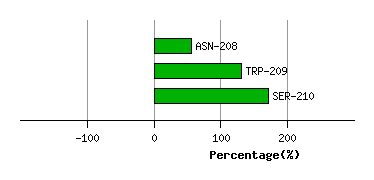
Graph shows rotational transition at bending residues and can be used
to identify hinge bending residues.
Probably only informative for interdomain rotations greater than 20 degrees
Residue
iResidue
i+1Distance of hinge axis to residue i in
(A) Distance of hinge axis to residue i in
(A) Change in
(deg) Change in
(deg) Angle of psi(i) axis to hinge axis
(deg) Angle of psi(i) axis to hinge axis
(deg) Percentage Progress
ALA-223
LEU-224
4.1
4.2
-2.7
6.8
165.7
163.9
41.7
LEU-224
ASN-225
3.9
4.0
-20.0
23.6
125.8
134.4
49.4
ASN-225
PRO-226
3.2
3.6
23.4
-13.9
37.5
40.8
50.6

Graph shows rotational transition at bending residues and can be used
to identify hinge bending residues.
Probably only informative for interdomain rotations greater than 20 degrees
Residue
iResidue
i+1Distance of hinge axis to residue i in
(A) Distance of hinge axis to residue i in
(A) Change in
(deg) Change in
(deg) Angle of psi(i) axis to hinge axis
(deg) Angle of psi(i) axis to hinge axis
(deg) Percentage Progress
VAL-248
ARG-249
13.9
14.6
19.2
-29.0
72.1
80.5
39.7
ARG-249
PHE-250
17.6
18.1
-19.1
-10.5
132.0
125.0
-107.9
PHE-250
THR-251
19.2
18.8
20.5
-19.9
92.9
66.1
34.5
THR-251
VAL-252
22.8
22.3
37.8
-9.8
38.0
50.4
119.2

Graph shows rotational transition at bending residues and can be used
to identify hinge bending residues.
Probably only informative for interdomain rotations greater than 20 degrees
Residue
iResidue
i+1Distance of hinge axis to residue i in
(A) Distance of hinge axis to residue i in
(A) Change in
(deg) Change in
(deg) Angle of psi(i) axis to hinge axis
(deg) Angle of psi(i) axis to hinge axis
(deg) Percentage Progress
ILE-296
PHE-297
18.2
19.5
8.8
-40.8
113.9
101.2
30.6
PHE-297
THR-298
15.3
16.7
49.1
-26.1
45.2
57.1
116.2
THR-298
ILE-299
13.1
13.5
12.8
-0.2
118.2
121.8
-38.0

Graph shows rotational transition at bending residues and can be used
to identify hinge bending residues.
Probably only informative for interdomain rotations greater than 20 degrees
Residue
iResidue
i+1Distance of hinge axis to residue i in
(A) Distance of hinge axis to residue i in
(A) Change in
(deg) Change in
(deg) Angle of psi(i) axis to hinge axis
(deg) Angle of psi(i) axis to hinge axis
(deg) Percentage Progress
LEU-306
PHE-307
12.4
11.9
-1.1
0.7
67.3
70.6
20.6
PHE-307
HIS-308
8.7
8.2
-16.7
15.1
116.4
114.0
-5.1
HIS-308
SER-309
6.1
5.5
-21.5
21.1
51.4
50.8
-4.1

Graph shows rotational transition at bending residues and can be used
to identify hinge bending residues.
Probably only informative for interdomain rotations greater than 20 degrees
Residue
iResidue
i+1Distance of hinge axis to residue i in
(A) Distance of hinge axis to residue i in
(A) Change in
(deg) Change in
(deg) Angle of psi(i) axis to hinge axis
(deg) Angle of psi(i) axis to hinge axis
(deg) Percentage Progress
ILE-342
THR-343
22.0
21.0
-10.7
7.8
141.0
153.3
-22.5
THR-343
VAL-344
20.9
20.2
13.5
-20.0
69.5
76.9
-37.9
VAL-344
GLU-345
17.4
17.0
-14.1
26.1
165.1
171.7
90.9
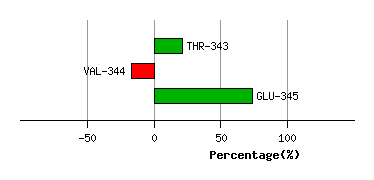
Graph shows rotational transition at bending residues and can be used
to identify hinge bending residues.
Probably only informative for interdomain rotations greater than 20 degrees
Residue
iResidue
i+1Distance of hinge axis to residue i in
(A) Distance of hinge axis to residue i in
(A) Change in
(deg) Change in
(deg) Angle of psi(i) axis to hinge axis
(deg) Angle of psi(i) axis to hinge axis
(deg) Percentage Progress
ILE-364
LYS-365
14.7
12.7
-2.9
21.2
130.0
121.8
73.7
LYS-365
HIS-366
16.6
14.8
5.5
3.2
14.7
8.0
69.7
HIS-366
GLY-367
14.9
14.2
-105.0
139.6
87.1
111.7
15.5
GLY-367
SER-368
14.9
14.2
-33.3
23.6
83.3
90.0
18.0
GLY-367
SER-368
14.9
14.2
-33.3
23.6
83.3
90.0
18.0

Graph shows rotational transition at bending residues and can be used
to identify hinge bending residues.
Probably only informative for interdomain rotations greater than 20 degrees
Residue
iResidue
i+1Distance of hinge axis to residue i in
(A) Distance of hinge axis to residue i in
(A) Change in
(deg) Change in
(deg) Angle of psi(i) axis to hinge axis
(deg) Angle of psi(i) axis to hinge axis
(deg) Percentage Progress
GLY-367
SER-368
14.9
14.2
-33.3
23.6
83.3
90.0
18.0
GLY-367
SER-368
14.9
14.2
-33.3
23.6
83.3
90.0
18.0
SER-368
ILE-369
12.1
12.2
-14.6
-11.1
28.8
27.4
150.6
ILE-369
PRO-370
11.0
10.8
-11.2
9.8
87.7
86.0
-25.0
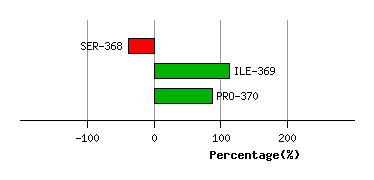
Graph shows rotational transition at bending residues and can be used
to identify hinge bending residues.
Probably only informative for interdomain rotations greater than 20 degrees
Residue
iResidue
i+1Distance of hinge axis to residue i in
(A) Distance of hinge axis to residue i in
(A) Change in
(deg) Change in
(deg) Angle of psi(i) axis to hinge axis
(deg) Angle of psi(i) axis to hinge axis
(deg) Percentage Progress
ASN-638
TYR-639
18.6
18.2
-8.9
3.5
122.1
131.1
-16.4
TYR-639
ASN-640
16.3
16.4
12.8
-29.3
52.5
50.5
-106.1
ASN-640
LEU-641
14.3
15.0
23.5
10.2
29.8
36.3
221.6

Graph shows rotational transition at bending residues and can be used
to identify hinge bending residues.
Probably only informative for interdomain rotations greater than 20 degrees
Residue
iResidue
i+1Distance of hinge axis to residue i in
(A) Distance of hinge axis to residue i in
(A) Change in
(deg) Change in
(deg) Angle of psi(i) axis to hinge axis
(deg) Angle of psi(i) axis to hinge axis
(deg) Percentage Progress
ASP-644
SER-645
13.5
13.6
73.3
-23.3
84.7
81.0
31.2
SER-645
LEU-646
12.0
12.0
2.5
-6.7
71.9
68.0
-57.1
LEU-646
ALA-647
13.7
13.4
18.7
-9.6
57.9
58.3
34.3

Graph shows rotational transition at bending residues and can be used
to identify hinge bending residues.
Probably only informative for interdomain rotations greater than 20 degrees