Aspartate Aminotransferase (E.C.2.6.1.1)
(All numbering and residues are taken from first PDB file)
![]()
![]()
Bending Residue Dihedral Analysis
Residue
iResidue
i+1Distance of hinge axis to residue i in
(A) Distance of hinge axis to residue i in
(A) Change in
(deg) Change in
(deg) Angle of psi(i) axis to hinge axis
(deg) Angle of psi(i) axis to hinge axis
(deg) Percentage Progress
GLY-38
VAL-39
6.2
7.3
-64.3
-9.3
19.1
43.1
402.0
VAL-39
TYR-40
5.6
5.8
15.9
9.9
105.9
103.7
-23.6
TYR-40
LYS-41
2.2
2.3
5.3
-2.5
134.2
135.9
-47.0
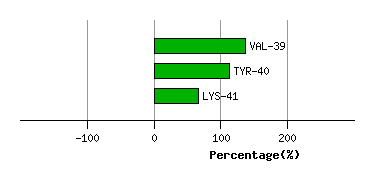
Graph shows rotational transition at bending residues and can be used
to identify hinge bending residues.
Probably only informative for interdomain rotations greater than 20 degrees
Residue
iResidue
i+1Distance of hinge axis to residue i in
(A) Distance of hinge axis to residue i in
(A) Change in
(deg) Change in
(deg) Angle of psi(i) axis to hinge axis
(deg) Angle of psi(i) axis to hinge axis
(deg) Percentage Progress
ARG-329
ILE-330
7.7
7.8
-3.5
-3.8
27.2
26.5
11.6
ILE-330
GLN-331
5.9
6.0
2.6
-0.5
130.7
133.0
1.6
GLN-331
ARG-332
9.0
9.2
-18.7
19.2
100.2
98.7
8.9

Graph shows rotational transition at bending residues and can be used
to identify hinge bending residues.
Probably only informative for interdomain rotations greater than 20 degrees
Residue
iResidue
i+1Distance of hinge axis to residue i in
(A) Distance of hinge axis to residue i in
(A) Change in
(deg) Change in
(deg) Angle of psi(i) axis to hinge axis
(deg) Angle of psi(i) axis to hinge axis
(deg) Percentage Progress
ARG-348
ASP-349
16.2
16.3
-0.5
2.4
56.8
64.8
-42.6
ASP-349
PHE-350
14.9
14.4
-12.6
4.4
67.8
50.9
23.9
PHE-350
SER-351
12.0
12.4
9.9
-9.5
111.4
110.7
-22.2
SER-351
PHE-352
12.7
12.1
-4.4
0.2
90.7
77.0
22.2
PHE-352
ILE-353
9.6
8.4
-4.6
-1.7
34.5
16.1
44.6
ILE-353
ILE-354
7.9
8.2
0.6
-31.7
130.6
126.8
106.7
ILE-354
LYS-355
10.1
10.4
8.2
-1.0
75.5
69.7
-25.0
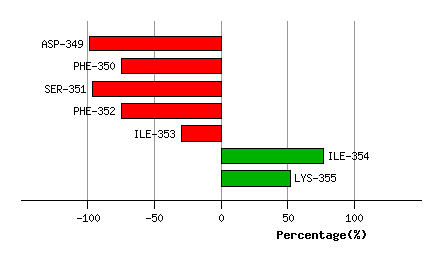
Graph shows rotational transition at bending residues and can be used
to identify hinge bending residues.
Probably only informative for interdomain rotations greater than 20 degrees
Residue
iResidue
i+1Distance of hinge axis to residue i in
(A) Distance of hinge axis to residue i in
(A) Change in
(deg) Change in
(deg) Angle of psi(i) axis to hinge axis
(deg) Angle of psi(i) axis to hinge axis
(deg) Percentage Progress
MET-359
PHE-360
1.2
1.3
-7.9
12.0
48.5
43.0
38.0
PHE-360
SER-361
0.8
0.9
-0.6
-21.5
39.9
47.7
80.1
SER-361
PHE-362
3.0
2.3
-3.0
-8.4
46.4
43.1
64.0

Graph shows rotational transition at bending residues and can be used
to identify hinge bending residues.
Probably only informative for interdomain rotations greater than 20 degrees