Udp-Galactose 4-Epimerase
(All numbering and residues are taken from first PDB file)
![]()
![]()
Bending Residue Dihedral Analysis
Residue
iResidue
i+1Distance of hinge axis to residue i in
(A) Distance of hinge axis to residue i in
(A) Change in
(deg) Change in
(deg) Angle of psi(i) axis to hinge axis
(deg) Angle of psi(i) axis to hinge axis
(deg) Percentage Progress
ALA-133
THR-134
8.5
8.4
1.2
10.1
114.0
108.8
-58.3
THR-134
VAL-135
12.3
12.2
-5.9
-0.7
37.4
29.6
43.0
VAL-135
TYR-136
12.2
11.8
4.4
-8.9
148.0
143.4
77.8
TYR-136
GLY-137
10.8
10.7
7.4
-6.7
105.4
103.4
-45.2
GLY-137
ASN-138
14.5
14.4
15.1
-16.2
92.0
87.2
39.0
GLY-137
ASN-138
14.5
14.4
15.1
-16.2
92.0
87.2
39.0

Graph shows rotational transition at bending residues and can be used
to identify hinge bending residues.
Probably only informative for interdomain rotations greater than 20 degrees
Residue
iResidue
i+1Distance of hinge axis to residue i in
(A) Distance of hinge axis to residue i in
(A) Change in
(deg) Change in
(deg) Angle of psi(i) axis to hinge axis
(deg) Angle of psi(i) axis to hinge axis
(deg) Percentage Progress
GLY-137
ASN-138
14.5
14.4
15.1
-16.2
92.0
87.2
39.0
GLY-137
ASN-138
14.5
14.4
15.1
-16.2
92.0
87.2
39.0
ASN-138
PRO-139
15.6
15.4
-12.6
-14.9
57.4
53.0
151.6
PRO-139
GLN-140
12.8
12.4
14.2
21.3
153.1
131.8
-311.9

Graph shows rotational transition at bending residues and can be used
to identify hinge bending residues.
Probably only informative for interdomain rotations greater than 20 degrees
Residue
iResidue
i+1Distance of hinge axis to residue i in
(A) Distance of hinge axis to residue i in
(A) Change in
(deg) Change in
(deg) Angle of psi(i) axis to hinge axis
(deg) Angle of psi(i) axis to hinge axis
(deg) Percentage Progress
ALA-147
HIS-148
3.5
4.2
7.8
10.3
83.8
76.9
76.3
HIS-148
PRO-149
6.2
6.4
5.1
-0.5
90.9
88.5
-50.2
PRO-149
THR-150
9.6
9.9
-3.1
15.6
25.9
25.1
-143.4
THR-150
GLY-151
11.6
11.9
-15.1
92.6
100.8
90.4
68.4
GLY-151
GLY-152
15.3
15.3
-18.5
157.2
97.3
17.8
-912.7
THR-154
ASN-155
19.6
19.8
5.9
7.4
142.4
140.5
-99.6
ASN-155
PRO-156
20.7
21.0
1.6
0.3
95.0
97.2
-12.4

Graph shows rotational transition at bending residues and can be used
to identify hinge bending residues.
Probably only informative for interdomain rotations greater than 20 degrees
Residue
iResidue
i+1Distance of hinge axis to residue i in
(A) Distance of hinge axis to residue i in
(A) Change in
(deg) Change in
(deg) Angle of psi(i) axis to hinge axis
(deg) Angle of psi(i) axis to hinge axis
(deg) Percentage Progress
TYR-185
PHE-186
5.0
4.8
-9.4
3.4
78.9
76.3
-9.5
PHE-186
ASN-187
5.8
5.8
13.9
0.1
29.0
31.0
120.9
ASN-187
PRO-188
7.6
7.5
-6.3
1.5
142.0
145.1
-56.4
PRO-188
THR-189
5.2
5.2
-5.8
8.2
39.6
37.6
-147.3
PRO-188
THR-189
5.2
5.2
-5.8
8.2
39.6
37.6
-147.3

Graph shows rotational transition at bending residues and can be used
to identify hinge bending residues.
Probably only informative for interdomain rotations greater than 20 degrees
Residue
iResidue
i+1Distance of hinge axis to residue i in
(A) Distance of hinge axis to residue i in
(A) Change in
(deg) Change in
(deg) Angle of psi(i) axis to hinge axis
(deg) Angle of psi(i) axis to hinge axis
(deg) Percentage Progress
PRO-188
THR-189
5.2
5.2
-5.8
8.2
39.6
37.6
-147.3
PRO-188
THR-189
5.2
5.2
-5.8
8.2
39.6
37.6
-147.3
THR-189
GLY-190
6.6
6.4
-12.6
6.8
53.5
52.2
215.6
GLY-190
ALA-191
5.8
5.3
1.6
0.8
128.1
126.9
2.0

Graph shows rotational transition at bending residues and can be used
to identify hinge bending residues.
Probably only informative for interdomain rotations greater than 20 degrees
Residue
iResidue
i+1Distance of hinge axis to residue i in
(A) Distance of hinge axis to residue i in
(A) Change in
(deg) Change in
(deg) Angle of psi(i) axis to hinge axis
(deg) Angle of psi(i) axis to hinge axis
(deg) Percentage Progress
ALA-193
SER-194
5.4
5.3
9.1
-6.9
6.3
7.8
37.2
SER-194
GLY-195
4.2
4.1
6.6
-3.6
69.7
69.2
8.2
GLY-195
CYS-196
3.4
2.6
0.7
-0.9
60.3
65.9
25.9
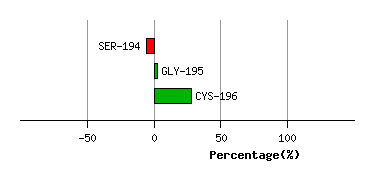
Graph shows rotational transition at bending residues and can be used
to identify hinge bending residues.
Probably only informative for interdomain rotations greater than 20 degrees
Residue
iResidue
i+1Distance of hinge axis to residue i in
(A) Distance of hinge axis to residue i in
(A) Change in
(deg) Change in
(deg) Angle of psi(i) axis to hinge axis
(deg) Angle of psi(i) axis to hinge axis
(deg) Percentage Progress
ILE-242
HIS-243
5.0
4.8
-6.6
2.5
19.9
21.6
42.6
HIS-243
VAL-244
4.0
3.9
-1.3
-5.2
85.7
87.5
-15.7
VAL-244
VAL-245
1.2
0.9
1.6
-2.0
98.2
100.4
9.3

Graph shows rotational transition at bending residues and can be used
to identify hinge bending residues.
Probably only informative for interdomain rotations greater than 20 degrees
Residue
iResidue
i+1Distance of hinge axis to residue i in
(A) Distance of hinge axis to residue i in
(A) Change in
(deg) Change in
(deg) Angle of psi(i) axis to hinge axis
(deg) Angle of psi(i) axis to hinge axis
(deg) Percentage Progress
ASN-268
LEU-269
2.1
1.8
1.2
6.3
36.6
37.1
26.9
LEU-269
GLY-270
0.8
0.7
2.5
1.8
73.3
76.2
-0.9
GLY-270
THR-271
3.0
3.1
-1.0
7.9
92.0
92.8
12.3

Graph shows rotational transition at bending residues and can be used
to identify hinge bending residues.
Probably only informative for interdomain rotations greater than 20 degrees
Residue
iResidue
i+1Distance of hinge axis to residue i in
(A) Distance of hinge axis to residue i in
(A) Change in
(deg) Change in
(deg) Angle of psi(i) axis to hinge axis
(deg) Angle of psi(i) axis to hinge axis
(deg) Percentage Progress
ALA-322
ALA-323
6.4
6.9
18.1
-30.3
105.6
110.8
156.3
ALA-323
LEU-324
9.5
9.8
17.5
-13.7
115.0
124.2
-75.1
LEU-324
GLY-325
9.1
9.1
-11.8
15.6
116.2
115.2
57.6
GLY-325
LEU-326
11.0
11.2
-4.9
-10.2
54.7
60.8
101.1

Graph shows rotational transition at bending residues and can be used
to identify hinge bending residues.
Probably only informative for interdomain rotations greater than 20 degrees
Residue
iResidue
i+1Distance of hinge axis to residue i in
(A) Distance of hinge axis to residue i in
(A) Change in
(deg) Change in
(deg) Angle of psi(i) axis to hinge axis
(deg) Angle of psi(i) axis to hinge axis
(deg) Percentage Progress
CYS-330
GLU-331
11.6
11.2
-8.1
4.4
161.3
158.0
-59.4
GLU-331
ASP-332
11.4
10.9
3.4
-2.9
66.2
68.1
33.7
ASP-332
LEU-333
7.6
7.1
-0.6
-1.7
102.5
100.7
-28.3

Graph shows rotational transition at bending residues and can be used
to identify hinge bending residues.
Probably only informative for interdomain rotations greater than 20 degrees
Residue
iResidue
i+1Distance of hinge axis to residue i in
(A) Distance of hinge axis to residue i in
(A) Change in
(deg) Change in
(deg) Angle of psi(i) axis to hinge axis
(deg) Angle of psi(i) axis to hinge axis
(deg) Percentage Progress
ARG-335
TRP-336
8.6
7.8
2.0
3.6
108.2
103.9
-53.0
TRP-336
GLN-337
6.2
5.8
-4.3
5.2
65.3
65.8
40.9
GLN-337
LYS-338
9.7
9.5
-1.5
-0.5
20.7
16.4
-15.4

Graph shows rotational transition at bending residues and can be used
to identify hinge bending residues.
Probably only informative for interdomain rotations greater than 20 degrees