Glutamate Receptor, Ionotropic Kainate 1
(All numbering and residues are taken from first PDB file)
![]()
![]()
Bending Residue Dihedral Analysis
Residue
iResidue
i+1Distance of hinge axis to residue i in
(A) Distance of hinge axis to residue i in
(A) Change in
(deg) Change in
(deg) Angle of psi(i) axis to hinge axis
(deg) Angle of psi(i) axis to hinge axis
(deg) Percentage Progress
THR-107
LEU-108
7.4
6.6
3.7
8.3
109.2
115.7
-15.6
LEU-108
GLY-109
4.1
3.0
-34.0
57.1
138.9
139.3
40.5
GLY-109
ILE-110
2.2
2.0
-43.7
24.2
62.4
72.1
12.7
ILE-110
SER-111
4.3
4.0
-0.6
-5.0
62.4
68.6
19.0

Graph shows rotational transition at bending residues and can be used
to identify hinge bending residues.
Probably only informative for interdomain rotations greater than 20 degrees
Residue
iResidue
i+1Distance of hinge axis to residue i in
(A) Distance of hinge axis to residue i in
(A) Change in
(deg) Change in
(deg) Angle of psi(i) axis to hinge axis
(deg) Angle of psi(i) axis to hinge axis
(deg) Percentage Progress
LEU-210
ILE-211
7.4
7.0
12.5
-5.0
157.2
149.9
-15.7
ILE-211
ASP-212
6.6
6.9
-165.5
132.5
72.6
44.4
-5.9
ASP-212
SER-213
3.6
4.1
136.9
-85.3
70.0
58.9
86.3
SER-213
LYS-214
4.2
3.5
3.2
4.3
98.8
104.1
-7.3
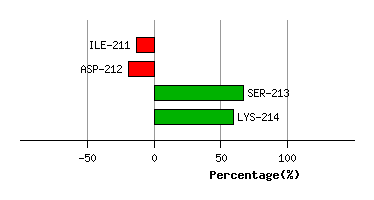
Graph shows rotational transition at bending residues and can be used
to identify hinge bending residues.
Probably only informative for interdomain rotations greater than 20 degrees
Residue
iResidue
i+1Distance of hinge axis to residue i in
(A) Distance of hinge axis to residue i in
(A) Change in
(deg) Change in
(deg) Angle of psi(i) axis to hinge axis
(deg) Angle of psi(i) axis to hinge axis
(deg) Percentage Progress
TRP-251
ARG-252
4.3
4.7
10.1
-0.4
143.3
143.4
-14.2
ARG-252
GLY-253
4.8
5.7
-18.9
-61.4
53.3
55.2
136.8
GLY-253
ASN-254
2.1
2.6
-25.5
62.9
24.9
57.6
-105.1
ASN-254
GLY-255
2.9
3.3
-121.4
16.7
75.2
113.3
16.6

Graph shows rotational transition at bending residues and can be used
to identify hinge bending residues.
Probably only informative for interdomain rotations greater than 20 degrees