L-Alanine Dehydrogenase
(All numbering and residues are taken from first PDB file)
![]()
![]()
Bending Residue Dihedral Analysis
Residue
iResidue
i+1Distance of hinge axis to residue i in
(A) Distance of hinge axis to residue i in
(A) Change in
(deg) Change in
(deg) Angle of psi(i) axis to hinge axis
(deg) Angle of psi(i) axis to hinge axis
(deg) Percentage Progress
ASP-232
LEU-233
11.5
11.4
0.6
-2.3
61.1
61.5
-18.8
LEU-233
LEU-234
8.6
8.6
0.5
-0.2
71.6
71.7
9.0
LEU-234
ILE-235
5.8
5.7
-0.4
-0.4
105.9
105.2
-4.8
ILE-235
GLY-236
3.8
3.9
4.2
-7.2
60.2
60.2
20.7

Graph shows rotational transition at bending residues and can be used
to identify hinge bending residues.
Probably only informative for interdomain rotations greater than 20 degrees
Residue
iResidue
i+1Distance of hinge axis to residue i in
(A) Distance of hinge axis to residue i in
(A) Change in
(deg) Change in
(deg) Angle of psi(i) axis to hinge axis
(deg) Angle of psi(i) axis to hinge axis
(deg) Percentage Progress
ILE-247
LEU-248
4.2
3.9
-17.3
7.1
135.2
130.1
-25.6
LEU-248
VAL-249
5.5
5.4
11.5
-8.3
86.1
85.1
11.0
VAL-249
PRO-250
5.5
5.7
-0.6
4.8
26.0
26.4
-25.6
PRO-250
ALA-251
7.4
7.6
1.5
-1.1
87.9
85.7
-0.1

Graph shows rotational transition at bending residues and can be used
to identify hinge bending residues.
Probably only informative for interdomain rotations greater than 20 degrees
Residue
iResidue
i+1Distance of hinge axis to residue i in
(A) Distance of hinge axis to residue i in
(A) Change in
(deg) Change in
(deg) Angle of psi(i) axis to hinge axis
(deg) Angle of psi(i) axis to hinge axis
(deg) Percentage Progress
GLY-260
SER-261
17.3
17.4
-2.3
-7.3
63.2
63.4
16.6
SER-261
VAL-262
13.6
13.8
3.7
-1.4
61.1
57.2
-11.7
VAL-262
ILE-263
11.5
11.5
3.9
0.0
78.8
80.2
3.2
ILE-263
VAL-264
8.4
8.3
-5.6
5.9
98.9
98.0
-8.1
VAL-264
ASP-265
7.9
7.9
-21.1
19.5
105.4
105.8
15.1
ASP-265
VAL-266
5.9
5.8
-11.2
-7.1
93.3
93.8
9.5
VAL-266
ALA-267
8.0
7.8
4.2
14.2
34.3
44.6
121.4
ALA-267
VAL-268
7.6
6.8
9.0
-2.6
33.6
24.9
-31.1

Graph shows rotational transition at bending residues and can be used
to identify hinge bending residues.
Probably only informative for interdomain rotations greater than 20 degrees
Residue
iResidue
i+1Distance of hinge axis to residue i in
(A) Distance of hinge axis to residue i in
(A) Change in
(deg) Change in
(deg) Angle of psi(i) axis to hinge axis
(deg) Angle of psi(i) axis to hinge axis
(deg) Percentage Progress
CYS-273
VAL-274
1.4
1.1
-0.8
0.5
86.4
84.6
1.9
VAL-274
GLU-275
2.6
2.7
7.5
-6.8
161.9
163.1
-2.0
GLU-275
THR-276
3.9
4.1
3.6
-2.8
107.1
107.9
-38.7
THR-276
LEU-277
7.0
7.2
12.0
-5.1
78.1
76.3
6.9
LEU-277
HIS-278
7.0
6.8
10.5
-6.6
130.0
135.2
-13.0
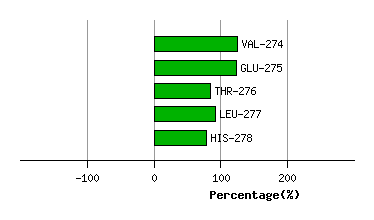
Graph shows rotational transition at bending residues and can be used
to identify hinge bending residues.
Probably only informative for interdomain rotations greater than 20 degrees