Endothia Aspartic Proteinase (Endothiapepsin) 3 (E.C.3.4.23.6)
(All numbering and residues are taken from first PDB file)
![]()
![]()
Bending Residue Dihedral Analysis
Residue
iResidue
i+1Distance of hinge axis to residue i in
(A) Distance of hinge axis to residue i in
(A) Change in
(deg) Change in
(deg) Angle of psi(i) axis to hinge axis
(deg) Angle of psi(i) axis to hinge axis
(deg) Percentage Progress
ASN-28
LEU-29
10.1
9.9
5.6
-6.8
39.0
42.4
23.6
LEU-29
ASP-30
8.4
8.1
-0.4
-8.4
152.6
157.8
-78.6
ASP-30
PHE-31
8.7
8.6
-11.9
5.8
109.4
115.1
-4.0
PHE-31
ASP-32
5.1
5.0
1.5
-1.6
161.7
162.7
5.2
PHE-31
ASP-32
5.1
5.0
1.5
-1.6
161.7
162.7
5.2

Graph shows rotational transition at bending residues and can be used
to identify hinge bending residues.
Probably only informative for interdomain rotations greater than 20 degrees
Residue
iResidue
i+1Distance of hinge axis to residue i in
(A) Distance of hinge axis to residue i in
(A) Change in
(deg) Change in
(deg) Angle of psi(i) axis to hinge axis
(deg) Angle of psi(i) axis to hinge axis
(deg) Percentage Progress
PHE-31
ASP-32
5.1
5.0
1.5
-1.6
161.7
162.7
5.2
PHE-31
ASP-32
5.1
5.0
1.5
-1.6
161.7
162.7
5.2
ASP-32
THR-33
5.5
5.2
3.5
-5.5
120.5
118.6
-85.4
THR-33
GLY-34
2.9
2.6
7.3
-25.8
130.0
132.7
302.6

Graph shows rotational transition at bending residues and can be used
to identify hinge bending residues.
Probably only informative for interdomain rotations greater than 20 degrees
Residue
iResidue
i+1Distance of hinge axis to residue i in
(A) Distance of hinge axis to residue i in
(A) Change in
(deg) Change in
(deg) Angle of psi(i) axis to hinge axis
(deg) Angle of psi(i) axis to hinge axis
(deg) Percentage Progress
THR-180
TYR-181
13.6
13.5
-18.2
8.8
73.9
74.4
59.6
TYR-181
THR-182
11.7
11.7
-8.0
2.3
143.5
141.4
-110.0
THR-182
ALA-183
9.2
9.3
-3.2
13.2
68.6
69.5
-81.5

Graph shows rotational transition at bending residues and can be used
to identify hinge bending residues.
Probably only informative for interdomain rotations greater than 20 degrees
Residue
iResidue
i+1Distance of hinge axis to residue i in
(A) Distance of hinge axis to residue i in
(A) Change in
(deg) Change in
(deg) Angle of psi(i) axis to hinge axis
(deg) Angle of psi(i) axis to hinge axis
(deg) Percentage Progress
ILE-207
ASP-211
1.8
2.0
2.0
-0.5
35.7
36.6
40.0
ASP-211
GLY-212
2.4
2.4
-1.8
1.5
136.2
134.8
-13.8
GLY-212
ILE-213
3.0
3.1
-6.5
21.5
153.6
153.6
285.4

Graph shows rotational transition at bending residues and can be used
to identify hinge bending residues.
Probably only informative for interdomain rotations greater than 20 degrees
Residue
iResidue
i+1Distance of hinge axis to residue i in
(A) Distance of hinge axis to residue i in
(A) Change in
(deg) Change in
(deg) Angle of psi(i) axis to hinge axis
(deg) Angle of psi(i) axis to hinge axis
(deg) Percentage Progress
ALA-214
ASP-215
2.3
2.1
7.7
-15.6
145.1
140.4
105.5
ASP-215
THR-216
4.8
4.7
-13.1
1.7
59.4
59.1
77.4
THR-216
GLY-217
6.2
6.2
9.1
0.4
107.2
109.9
21.2
GLY-217
THR-218
8.4
8.2
-12.8
7.1
46.8
53.1
90.3
GLY-217
THR-218
8.4
8.2
-12.8
7.1
46.8
53.1
90.3

Graph shows rotational transition at bending residues and can be used
to identify hinge bending residues.
Probably only informative for interdomain rotations greater than 20 degrees
Residue
iResidue
i+1Distance of hinge axis to residue i in
(A) Distance of hinge axis to residue i in
(A) Change in
(deg) Change in
(deg) Angle of psi(i) axis to hinge axis
(deg) Angle of psi(i) axis to hinge axis
(deg) Percentage Progress
GLY-217
THR-218
8.4
8.2
-12.8
7.1
46.8
53.1
90.3
GLY-217
THR-218
8.4
8.2
-12.8
7.1
46.8
53.1
90.3
THR-218
THR-219
10.4
10.4
-3.3
9.6
79.5
84.3
2.1
THR-219
LEU-220
13.1
13.1
-5.4
8.3
30.1
23.8
-177.1
LEU-220
LEU-221
13.4
13.4
-5.2
4.8
56.0
56.7
99.1

Graph shows rotational transition at bending residues and can be used
to identify hinge bending residues.
Probably only informative for interdomain rotations greater than 20 degrees
Residue
iResidue
i+1Distance of hinge axis to residue i in
(A) Distance of hinge axis to residue i in
(A) Change in
(deg) Change in
(deg) Angle of psi(i) axis to hinge axis
(deg) Angle of psi(i) axis to hinge axis
(deg) Percentage Progress
PRO-269
GLY-270
19.5
19.4
21.9
-23.1
96.3
87.3
-307.7
GLY-270
ASP-271
21.0
20.8
14.3
22.3
38.1
38.2
504.5
ASP-271
TYR-272
22.5
22.3
-18.7
2.5
124.2
115.4
-308.9

Graph shows rotational transition at bending residues and can be used
to identify hinge bending residues.
Probably only informative for interdomain rotations greater than 20 degrees
Residue
iResidue
i+1Distance of hinge axis to residue i in
(A) Distance of hinge axis to residue i in
(A) Change in
(deg) Change in
(deg) Angle of psi(i) axis to hinge axis
(deg) Angle of psi(i) axis to hinge axis
(deg) Percentage Progress
ILE-273
ASP-274
18.7
18.8
10.3
-5.6
95.2
98.2
-83.2
ASP-274
PHE-275
22.2
22.2
16.6
-44.5
154.1
149.8
519.9
PHE-275
GLY-276
21.2
22.0
75.6
-92.5
128.1
101.0
-131.1
GLY-276
PRO-277
24.6
25.7
25.6
-17.3
65.4
77.4
-293.0
PRO-277
ILE-278
27.9
28.3
0.2
5.9
101.4
102.8
103.2
ILE-278
SER-279
27.6
27.8
-6.6
3.6
38.7
40.7
120.9
SER-279
THR-280
30.4
30.6
11.5
2.5
111.4
110.6
-63.7
THR-280
GLY-281
31.9
32.5
2.7
-5.7
62.4
57.1
111.8
GLY-281
SER-282
34.6
35.2
-25.4
18.5
169.2
168.5
-218.4
SER-282
SER-282A
33.5
33.5
-8.5
-21.7
124.0
114.2
-561.9
SER-282A
SER-282B
33.4
33.2
31.4
7.1
69.8
52.1
661.9
SER-282B
CYS-283
30.2
30.2
-10.3
15.7
45.3
47.9
-154.5

Graph shows rotational transition at bending residues and can be used
to identify hinge bending residues.
Probably only informative for interdomain rotations greater than 20 degrees
Residue
iResidue
i+1Distance of hinge axis to residue i in
(A) Distance of hinge axis to residue i in
(A) Change in
(deg) Change in
(deg) Angle of psi(i) axis to hinge axis
(deg) Angle of psi(i) axis to hinge axis
(deg) Percentage Progress
ASN-300
ILE-301
7.1
7.3
-9.1
14.4
158.6
153.5
120.2
ILE-301
PHE-302
6.9
7.0
3.6
-2.0
85.6
89.3
-4.3
PHE-302
GLY-303
6.2
6.3
-0.3
2.2
163.6
165.4
21.5

Graph shows rotational transition at bending residues and can be used
to identify hinge bending residues.
Probably only informative for interdomain rotations greater than 20 degrees
Residue
iResidue
i+1Distance of hinge axis to residue i in
(A) Distance of hinge axis to residue i in
(A) Change in
(deg) Change in
(deg) Angle of psi(i) axis to hinge axis
(deg) Angle of psi(i) axis to hinge axis
(deg) Percentage Progress
ASP-304
VAL-305
10.6
10.5
-2.8
7.6
124.0
127.8
236.3
VAL-305
ALA-306
13.1
12.9
0.6
-17.6
61.7
65.1
-212.9
ALA-306
LEU-307
10.6
10.5
-2.0
11.2
45.1
50.6
144.3
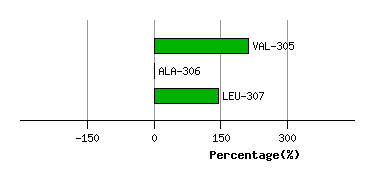
Graph shows rotational transition at bending residues and can be used
to identify hinge bending residues.
Probably only informative for interdomain rotations greater than 20 degrees
Residue
iResidue
i+1Distance of hinge axis to residue i in
(A) Distance of hinge axis to residue i in
(A) Change in
(deg) Change in
(deg) Angle of psi(i) axis to hinge axis
(deg) Angle of psi(i) axis to hinge axis
(deg) Percentage Progress
ALA-309
ALA-310
14.3
14.1
4.9
-13.7
89.8
93.1
-98.5
ALA-310
PHE-311
12.6
12.6
-6.6
2.2
160.5
152.8
-27.1
PHE-311
VAL-312
12.3
12.3
-20.7
24.1
73.8
78.7
-2.6
VAL-312
VAL-313
8.9
8.9
16.9
-19.6
49.8
49.0
34.3
VAL-313
PHE-314
8.9
8.8
-0.7
3.1
77.7
77.2
-62.6
VAL-313
PHE-314
8.9
8.8
-0.7
3.1
77.7
77.2
-62.6

Graph shows rotational transition at bending residues and can be used
to identify hinge bending residues.
Probably only informative for interdomain rotations greater than 20 degrees
Residue
iResidue
i+1Distance of hinge axis to residue i in
(A) Distance of hinge axis to residue i in
(A) Change in
(deg) Change in
(deg) Angle of psi(i) axis to hinge axis
(deg) Angle of psi(i) axis to hinge axis
(deg) Percentage Progress
VAL-313
PHE-314
8.9
8.8
-0.7
3.1
77.7
77.2
-62.6
VAL-313
PHE-314
8.9
8.8
-0.7
3.1
77.7
77.2
-62.6
PHE-314
ASN-315
6.5
6.6
-2.4
22.3
108.2
109.3
330.3
ASN-315
GLY-316
9.7
9.9
5.0
-0.2
86.7
82.7
-178.8
GLY-316
ALA-317
9.9
10.1
16.3
-16.0
98.9
94.6
13.5
GLY-316
ALA-317
9.9
10.1
16.3
-16.0
98.9
94.6
13.5

Graph shows rotational transition at bending residues and can be used
to identify hinge bending residues.
Probably only informative for interdomain rotations greater than 20 degrees
Residue
iResidue
i+1Distance of hinge axis to residue i in
(A) Distance of hinge axis to residue i in
(A) Change in
(deg) Change in
(deg) Angle of psi(i) axis to hinge axis
(deg) Angle of psi(i) axis to hinge axis
(deg) Percentage Progress
GLY-316
ALA-317
9.9
10.1
16.3
-16.0
98.9
94.6
13.5
GLY-316
ALA-317
9.9
10.1
16.3
-16.0
98.9
94.6
13.5
ALA-317
THR-318
13.7
13.7
60.9
-81.6
61.5
75.0
-694.3
THR-318
THR-319
15.6
14.7
23.7
28.7
23.5
8.2
975.0
THR-319
PRO-319B
14.4
14.4
-17.8
-14.7
88.0
80.0
-203.6
PRO-319B
THR-320
10.7
11.0
-13.4
19.4
141.8
132.4
-125.6
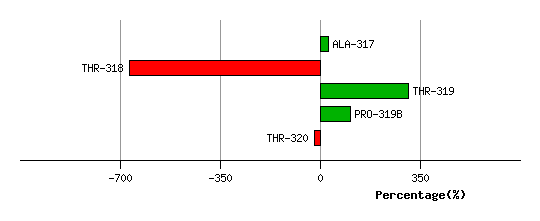
Graph shows rotational transition at bending residues and can be used
to identify hinge bending residues.
Probably only informative for interdomain rotations greater than 20 degrees
Residue
iResidue
i+1Distance of hinge axis to residue i in
(A) Distance of hinge axis to residue i in
(A) Change in
(deg) Change in
(deg) Angle of psi(i) axis to hinge axis
(deg) Angle of psi(i) axis to hinge axis
(deg) Percentage Progress
LEU-321
GLY-322
7.2
7.4
-2.6
5.6
75.7
72.4
-32.3
GLY-322
PHE-323
10.0
10.1
1.8
5.5
92.6
91.9
144.0
PHE-323
ALA-324
10.7
10.8
5.8
-2.5
93.2
89.6
-114.2
ALA-324
SER-325
14.2
14.3
4.4
16.4
91.3
90.5
315.1

Graph shows rotational transition at bending residues and can be used
to identify hinge bending residues.
Probably only informative for interdomain rotations greater than 20 degrees