Glycyl-Trna Synthetase
(All numbering and residues are taken from first PDB file)
![]()
![]()
Bending Residue Dihedral Analysis
Residue
iResidue
i+1Distance of hinge axis to residue i in
(A) Distance of hinge axis to residue i in
(A) Change in
(deg) Change in
(deg) Angle of psi(i) axis to hinge axis
(deg) Angle of psi(i) axis to hinge axis
(deg) Percentage Progress
ASP-142
LYS-143
14.3
14.8
-73.8
12.6
52.0
107.0
-33.6
LYS-143
PHE-144
13.8
13.9
-1.7
37.5
107.2
116.9
12.2
PHE-144
ALA-145
10.5
10.4
38.1
-37.8
16.2
8.0
-4.0

Graph shows rotational transition at bending residues and can be used
to identify hinge bending residues.
Probably only informative for interdomain rotations greater than 20 degrees
Residue
iResidue
i+1Distance of hinge axis to residue i in
(A) Distance of hinge axis to residue i in
(A) Change in
(deg) Change in
(deg) Angle of psi(i) axis to hinge axis
(deg) Angle of psi(i) axis to hinge axis
(deg) Percentage Progress
ASN-225
LEU-226
10.8
10.8
-15.0
12.5
72.1
68.3
17.1
LEU-226
MET-227
7.1
7.1
-2.0
0.8
112.6
108.4
26.6
MET-227
PHE-228
6.7
6.6
2.1
-1.6
130.1
130.2
-3.3

Graph shows rotational transition at bending residues and can be used
to identify hinge bending residues.
Probably only informative for interdomain rotations greater than 20 degrees
Residue
iResidue
i+1Distance of hinge axis to residue i in
(A) Distance of hinge axis to residue i in
(A) Change in
(deg) Change in
(deg) Angle of psi(i) axis to hinge axis
(deg) Angle of psi(i) axis to hinge axis
(deg) Percentage Progress
LEU-242
ARG-243
6.8
6.5
-0.3
-3.6
60.8
60.3
18.1
ARG-243
PRO-244
4.2
3.9
-4.4
-1.8
120.8
118.4
-17.7
PRO-244
GLU-245
2.0
1.7
19.5
-20.3
120.3
126.3
14.1
GLU-245
THR-246
1.0
1.0
2.3
-2.1
129.7
131.0
28.5
THR-246
ALA-247
2.5
2.2
-12.6
33.0
16.6
24.3
-127.7

Graph shows rotational transition at bending residues and can be used
to identify hinge bending residues.
Probably only informative for interdomain rotations greater than 20 degrees
Residue
iResidue
i+1Distance of hinge axis to residue i in
(A) Distance of hinge axis to residue i in
(A) Change in
(deg) Change in
(deg) Angle of psi(i) axis to hinge axis
(deg) Angle of psi(i) axis to hinge axis
(deg) Percentage Progress
ARG-277
ASN-278
1.8
1.8
-1.5
-0.8
166.3
164.3
-23.0
ASN-278
GLU-279
3.4
3.5
-17.2
17.2
120.6
115.8
14.8
GLU-279
ILE-280
4.2
4.7
-13.0
17.6
151.2
150.3
23.2
ILE-280
SER-281
6.2
7.1
-5.7
1.6
145.1
147.5
-31.1
SER-281
PRO-282
5.7
6.9
13.6
2.3
104.0
103.0
-26.0
PRO-282
ARG-283
5.8
6.5
-0.5
5.3
138.8
141.5
31.3
ARG-283
SER-284
8.1
9.3
-35.1
35.4
72.9
68.2
-31.6
SER-284
GLY-285
10.9
11.6
-9.6
-3.8
60.1
79.9
34.8

Graph shows rotational transition at bending residues and can be used
to identify hinge bending residues.
Probably only informative for interdomain rotations greater than 20 degrees
Residue
iResidue
i+1Distance of hinge axis to residue i in
(A) Distance of hinge axis to residue i in
(A) Change in
(deg) Change in
(deg) Angle of psi(i) axis to hinge axis
(deg) Angle of psi(i) axis to hinge axis
(deg) Percentage Progress
ARG-288
VAL-289
7.9
8.1
-0.8
1.6
105.1
105.5
33.2
VAL-289
ARG-290
5.2
5.4
2.5
-8.5
117.1
117.1
18.2
ARG-290
GLU-291
1.8
1.9
37.6
-34.8
135.6
131.0
-40.9
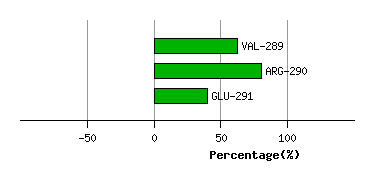
Graph shows rotational transition at bending residues and can be used
to identify hinge bending residues.
Probably only informative for interdomain rotations greater than 20 degrees
Residue
iResidue
i+1Distance of hinge axis to residue i in
(A) Distance of hinge axis to residue i in
(A) Change in
(deg) Change in
(deg) Angle of psi(i) axis to hinge axis
(deg) Angle of psi(i) axis to hinge axis
(deg) Percentage Progress
ALA-295
GLU-296
9.9
9.8
13.1
-21.0
52.3
56.9
-59.7
GLU-296
ILE-297
7.7
7.8
-13.8
22.2
161.2
169.4
93.4
ILE-297
GLU-298
8.6
8.6
3.7
4.1
60.8
64.5
37.1

Graph shows rotational transition at bending residues and can be used
to identify hinge bending residues.
Probably only informative for interdomain rotations greater than 20 degrees