Hexokinase-1
(All numbering and residues are taken from first PDB file)
![]()
![]()
Bending Residue Dihedral Analysis
Residue
iResidue
i+1Distance of hinge axis to residue i in
(A) Distance of hinge axis to residue i in
(A) Change in
(deg) Change in
(deg) Angle of psi(i) axis to hinge axis
(deg) Angle of psi(i) axis to hinge axis
(deg) Percentage Progress
PHE-73
PRO-74
7.1
7.5
4.7
0.7
137.7
137.7
4.8
PRO-74
THR-75
7.1
7.9
8.1
11.5
105.8
99.2
9.9
THR-75
GLY-76
10.8
11.6
6.5
-14.4
170.7
164.0
37.0

Graph shows rotational transition at bending residues and can be used
to identify hinge bending residues.
Probably only informative for interdomain rotations greater than 20 degrees
Residue
iResidue
i+1Distance of hinge axis to residue i in
(A) Distance of hinge axis to residue i in
(A) Change in
(deg) Change in
(deg) Angle of psi(i) axis to hinge axis
(deg) Angle of psi(i) axis to hinge axis
(deg) Percentage Progress
ASN-102
HIS-103
12.3
13.2
18.6
-5.9
108.0
94.2
-18.0
HIS-103
THR-104
10.3
10.5
12.6
1.5
57.6
38.6
93.1
THR-104
PHE-105
7.4
8.4
-25.7
-6.5
94.5
88.8
-59.3
PHE-105
ASP-106
5.1
5.8
1.6
3.4
155.5
149.0
-45.6
PHE-105
ASP-106
5.1
5.8
1.6
3.4
155.5
149.0
-45.6

Graph shows rotational transition at bending residues and can be used
to identify hinge bending residues.
Probably only informative for interdomain rotations greater than 20 degrees
Residue
iResidue
i+1Distance of hinge axis to residue i in
(A) Distance of hinge axis to residue i in
(A) Change in
(deg) Change in
(deg) Angle of psi(i) axis to hinge axis
(deg) Angle of psi(i) axis to hinge axis
(deg) Percentage Progress
PHE-105
ASP-106
5.1
5.8
1.6
3.4
155.5
149.0
-45.6
PHE-105
ASP-106
5.1
5.8
1.6
3.4
155.5
149.0
-45.6
ASP-106
THR-107
4.8
4.7
22.2
-7.6
78.9
73.9
77.5
THR-107
THR-108
4.1
3.8
27.8
-29.1
141.1
144.0
2.3

Graph shows rotational transition at bending residues and can be used
to identify hinge bending residues.
Probably only informative for interdomain rotations greater than 20 degrees
Residue
iResidue
i+1Distance of hinge axis to residue i in
(A) Distance of hinge axis to residue i in
(A) Change in
(deg) Change in
(deg) Angle of psi(i) axis to hinge axis
(deg) Angle of psi(i) axis to hinge axis
(deg) Percentage Progress
ILE-209
ASN-210
8.2
8.1
28.8
-10.3
76.8
72.8
65.2
ASN-210
ASP-211
9.6
9.5
6.0
-11.3
42.4
42.0
6.5
ASP-211
THR-212
9.7
8.8
11.6
-2.0
102.6
101.9
-18.4
THR-212
VAL-213
9.8
8.9
-6.4
5.8
72.4
66.8
-6.5
VAL-213
GLY-214
6.3
5.7
20.2
-17.5
40.3
46.0
-21.9
VAL-213
GLY-214
6.3
5.7
20.2
-17.5
40.3
46.0
-21.9

Graph shows rotational transition at bending residues and can be used
to identify hinge bending residues.
Probably only informative for interdomain rotations greater than 20 degrees
Residue
iResidue
i+1Distance of hinge axis to residue i in
(A) Distance of hinge axis to residue i in
(A) Change in
(deg) Change in
(deg) Angle of psi(i) axis to hinge axis
(deg) Angle of psi(i) axis to hinge axis
(deg) Percentage Progress
VAL-213
GLY-214
6.3
5.7
20.2
-17.5
40.3
46.0
-21.9
VAL-213
GLY-214
6.3
5.7
20.2
-17.5
40.3
46.0
-21.9
GLY-214
THR-215
4.7
3.8
3.9
9.4
59.6
60.2
65.9
THR-215
LEU-216
6.7
6.1
0.6
-7.5
118.8
114.0
20.8

Graph shows rotational transition at bending residues and can be used
to identify hinge bending residues.
Probably only informative for interdomain rotations greater than 20 degrees
Residue
iResidue
i+1Distance of hinge axis to residue i in
(A) Distance of hinge axis to residue i in
(A) Change in
(deg) Change in
(deg) Angle of psi(i) axis to hinge axis
(deg) Angle of psi(i) axis to hinge axis
(deg) Percentage Progress
ASP-457
GLY-458
5.2
5.0
18.8
-4.3
25.9
30.9
72.2
GLY-458
SER-459
5.7
5.3
10.0
8.8
85.4
88.1
-0.6
SER-459
GLY-460
7.3
7.2
-20.3
5.5
58.7
69.5
35.0
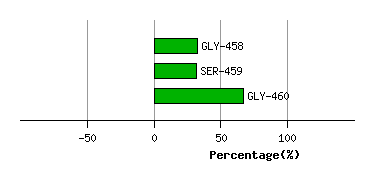
Graph shows rotational transition at bending residues and can be used
to identify hinge bending residues.
Probably only informative for interdomain rotations greater than 20 degrees
Residue
iResidue
i+1Distance of hinge axis to residue i in
(A) Distance of hinge axis to residue i in
(A) Change in
(deg) Change in
(deg) Angle of psi(i) axis to hinge axis
(deg) Angle of psi(i) axis to hinge axis
(deg) Percentage Progress
VAL-465
ILE-466
3.7
4.2
-10.6
11.4
15.3
15.3
-1.1
ILE-466
ALA-467
3.9
4.1
-2.8
4.3
82.3
83.9
-13.6
ALA-467
ALA-468
7.6
7.8
-7.2
5.5
87.4
87.7
7.0
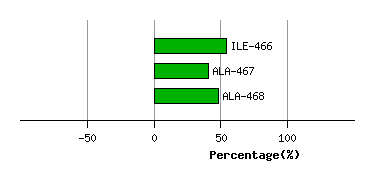
Graph shows rotational transition at bending residues and can be used
to identify hinge bending residues.
Probably only informative for interdomain rotations greater than 20 degrees
Residue
iResidue
i+1Distance of hinge axis to residue i in
(A) Distance of hinge axis to residue i in
(A) Change in
(deg) Change in
(deg) Angle of psi(i) axis to hinge axis
(deg) Angle of psi(i) axis to hinge axis
(deg) Percentage Progress
SER-479
LEU-480
10.5
10.4
-20.2
6.8
52.8
40.4
60.2
LEU-480
GLY-481
8.3
8.5
-13.1
3.2
113.9
110.6
-20.2
GLY-481
ILE-482
8.3
7.8
2.4
5.7
7.5
8.2
69.4
ILE-482
ILE-483
8.6
7.7
12.0
-4.3
72.6
68.9
-32.2
ILE-483
GLY-484
11.0
10.1
-7.2
36.9
96.8
93.6
-41.1

Graph shows rotational transition at bending residues and can be used
to identify hinge bending residues.
Probably only informative for interdomain rotations greater than 20 degrees