Succinyl-Coa:3-Ketoacid-Coenzyme A Transferase 1, Mitochondrial
(All numbering and residues are taken from first PDB file)
![]()
![]()
Bending Residue Dihedral Analysis
Residue
iResidue
i+1Distance of hinge axis to residue i in
(A) Distance of hinge axis to residue i in
(A) Change in
(deg) Change in
(deg) Angle of psi(i) axis to hinge axis
(deg) Angle of psi(i) axis to hinge axis
(deg) Percentage Progress
LEU-243
SER-244
24.5
24.7
-10.3
10.3
115.4
122.5
13.6
SER-244
VAL-245
22.0
22.4
-6.6
-0.8
167.6
167.5
-44.6
VAL-245
ARG-246
22.9
23.5
-12.3
-7.3
128.6
122.3
-86.4
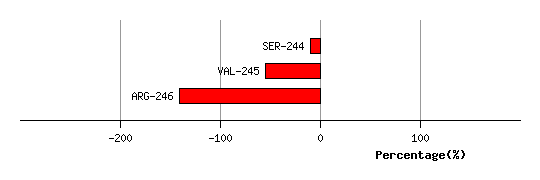
Graph shows rotational transition at bending residues and can be used
to identify hinge bending residues.
Probably only informative for interdomain rotations greater than 20 degrees
Residue
iResidue
i+1Distance of hinge axis to residue i in
(A) Distance of hinge axis to residue i in
(A) Change in
(deg) Change in
(deg) Angle of psi(i) axis to hinge axis
(deg) Angle of psi(i) axis to hinge axis
(deg) Percentage Progress
ASP-276
GLY-277
3.5
3.4
0.1
4.1
68.2
69.5
10.1
GLY-277
MET-278
2.1
2.6
-0.6
-1.7
174.2
177.0
0.3
MET-278
TYR-279
2.0
2.1
-4.0
2.4
115.8
117.9
15.6
TYR-279
ALA-280
1.8
2.0
8.5
-3.2
39.7
43.1
12.1
ALA-280
ASN-281
1.5
1.3
16.4
-23.7
57.6
51.9
-110.6
ASN-281
LEU-282
3.5
3.4
-22.2
1.0
103.6
105.0
-46.2
ASN-281
LEU-282
3.5
3.4
-22.2
1.0
103.6
105.0
-46.2

Graph shows rotational transition at bending residues and can be used
to identify hinge bending residues.
Probably only informative for interdomain rotations greater than 20 degrees
Residue
iResidue
i+1Distance of hinge axis to residue i in
(A) Distance of hinge axis to residue i in
(A) Change in
(deg) Change in
(deg) Angle of psi(i) axis to hinge axis
(deg) Angle of psi(i) axis to hinge axis
(deg) Percentage Progress
ASN-281
LEU-282
3.5
3.4
-22.2
1.0
103.6
105.0
-46.2
ASN-281
LEU-282
3.5
3.4
-22.2
1.0
103.6
105.0
-46.2
LEU-282
GLY-283
6.9
6.6
8.1
8.0
27.8
41.9
114.6
GLY-283
ILE-284
7.8
8.6
-0.2
-1.7
95.8
75.5
-6.9
ILE-284
GLY-285
11.3
12.3
-5.5
-6.5
91.5
82.6
0.4
GLY-285
ILE-286
14.0
14.9
14.0
1.1
154.0
139.2
-94.5
ILE-286
PRO-287
14.7
14.5
-6.3
-8.3
44.7
55.9
71.1
PRO-287
LEU-288
11.3
10.8
-13.7
-6.6
52.7
48.1
67.0
LEU-288
LEU-289
12.5
11.4
-12.8
1.1
30.7
44.0
74.6
LEU-289
ALA-290
14.7
14.5
-8.6
1.1
39.1
47.6
-5.8
ALA-290
SER-291
11.7
12.6
-5.1
1.6
46.6
42.8
11.2
SER-291
ASN-292
11.2
10.3
-16.0
33.4
41.4
37.2
-72.7
ASN-292
PHE-293
14.2
13.4
-13.6
19.4
56.9
45.7
-27.4
PHE-293
ILE-294
13.0
13.2
-20.4
14.8
67.7
64.8
-0.2
MET-298
THR-299
4.7
4.2
-16.3
10.1
113.0
109.1
-40.2
THR-299
VAL-300
2.6
2.2
1.6
-3.7
16.2
15.7
-37.2
VAL-300
HIS-301
3.0
2.6
-2.6
0.3
115.5
116.9
23.9
HIS-301
LEU-302
4.1
4.3
4.4
6.0
16.8
15.2
49.0
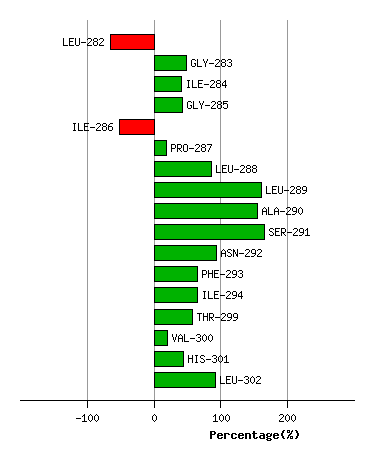
Graph shows rotational transition at bending residues and can be used
to identify hinge bending residues.
Probably only informative for interdomain rotations greater than 20 degrees
Residue
iResidue
i+1Distance of hinge axis to residue i in
(A) Distance of hinge axis to residue i in
(A) Change in
(deg) Change in
(deg) Angle of psi(i) axis to hinge axis
(deg) Angle of psi(i) axis to hinge axis
(deg) Percentage Progress
VAL-355
ASN-356
4.0
4.1
-1.6
4.5
89.7
97.5
-27.1
ASN-356
LEU-357
4.3
4.5
-7.9
17.8
59.7
62.6
-15.4
LEU-357
THR-358
3.4
3.6
-22.3
19.5
62.5
52.9
37.2

Graph shows rotational transition at bending residues and can be used
to identify hinge bending residues.
Probably only informative for interdomain rotations greater than 20 degrees
Residue
iResidue
i+1Distance of hinge axis to residue i in
(A) Distance of hinge axis to residue i in
(A) Change in
(deg) Change in
(deg) Angle of psi(i) axis to hinge axis
(deg) Angle of psi(i) axis to hinge axis
(deg) Percentage Progress
ALA-372
ASN-373
9.6
9.6
-9.9
5.6
61.6
55.0
30.4
ASN-373
TRP-374
9.8
9.5
-3.2
-3.8
109.7
107.1
-25.6
TRP-374
MET-375
9.4
8.8
3.2
15.5
37.9
34.4
106.9
MET-375
ILE-376
11.4
10.5
-14.2
-4.6
108.2
103.4
-51.5
ILE-376
PRO-377
14.3
13.8
14.7
4.4
24.2
23.6
107.5
PRO-377
GLY-378
13.2
13.9
-149.5
-156.6
117.7
104.4
85.8
VAL-381
LYS-382
14.4
13.2
7.7
-26.4
155.0
133.2
120.9
LYS-382
GLY-383
13.2
13.1
19.7
22.8
89.1
106.0
-92.9
GLY-383
MET-384
9.9
9.6
13.1
-13.6
140.6
144.2
-21.2
MET-384
GLY-385
6.9
6.7
6.5
2.8
150.6
150.7
-50.5
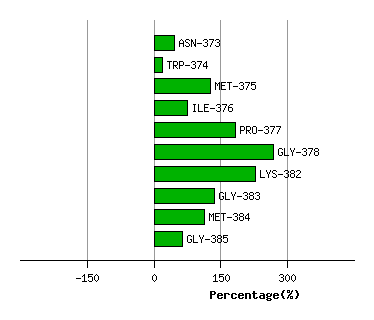
Graph shows rotational transition at bending residues and can be used
to identify hinge bending residues.
Probably only informative for interdomain rotations greater than 20 degrees
Residue
iResidue
i+1Distance of hinge axis to residue i in
(A) Distance of hinge axis to residue i in
(A) Change in
(deg) Change in
(deg) Angle of psi(i) axis to hinge axis
(deg) Angle of psi(i) axis to hinge axis
(deg) Percentage Progress
SER-393
ALA-394
7.2
7.6
-3.1
-6.9
107.6
114.0
-56.6
ALA-394
LYS-395
10.0
10.1
5.3
13.0
9.0
4.3
140.7
LYS-395
THR-396
9.1
9.9
-19.2
21.2
109.6
119.6
22.9
THR-396
LYS-397
5.8
6.5
16.6
-4.0
103.1
98.9
-25.0
LYS-397
VAL-398
7.1
7.5
-17.9
9.4
67.0
64.1
31.7

Graph shows rotational transition at bending residues and can be used
to identify hinge bending residues.
Probably only informative for interdomain rotations greater than 20 degrees