Beta-Actin
(All numbering and residues are taken from first PDB file)
![]()
![]()
Bending Residue Dihedral Analysis
Residue
iResidue
i+1Distance of hinge axis to residue i in
(A) Distance of hinge axis to residue i in
(A) Change in
(deg) Change in
(deg) Angle of psi(i) axis to hinge axis
(deg) Angle of psi(i) axis to hinge axis
(deg) Percentage Progress
ARG-147
THR-148
10.4
10.7
-5.0
-4.3
49.9
47.7
74.2
THR-148
THR-149
11.8
12.2
-9.3
3.8
118.7
118.8
-18.4
THR-149
GLY-150
11.2
11.8
6.0
-5.0
65.6
64.6
12.2

Graph shows rotational transition at bending residues and can be used
to identify hinge bending residues.
Probably only informative for interdomain rotations greater than 20 degrees
Residue
iResidue
i+1Distance of hinge axis to residue i in
(A) Distance of hinge axis to residue i in
(A) Change in
(deg) Change in
(deg) Angle of psi(i) axis to hinge axis
(deg) Angle of psi(i) axis to hinge axis
(deg) Percentage Progress
VAL-163
PRO-164
9.6
9.6
0.1
-0.3
127.0
125.4
-4.4
PRO-164
ILE-165
10.8
11.0
-6.5
7.5
125.0
125.2
28.2
ILE-165
TYR-166
11.4
11.7
4.2
-4.1
125.9
124.9
8.7

Graph shows rotational transition at bending residues and can be used
to identify hinge bending residues.
Probably only informative for interdomain rotations greater than 20 degrees
Residue
iResidue
i+1Distance of hinge axis to residue i in
(A) Distance of hinge axis to residue i in
(A) Change in
(deg) Change in
(deg) Angle of psi(i) axis to hinge axis
(deg) Angle of psi(i) axis to hinge axis
(deg) Percentage Progress
TYR-169
ALA-170
14.7
14.8
4.9
10.2
67.2
62.9
39.1
ALA-170
LEU-171
13.0
13.1
13.7
-13.8
78.6
75.9
-63.2
LEU-171
PRO-172
15.8
15.7
-19.4
19.1
69.6
74.9
122.3

Graph shows rotational transition at bending residues and can be used
to identify hinge bending residues.
Probably only informative for interdomain rotations greater than 20 degrees
Residue
iResidue
i+1Distance of hinge axis to residue i in
(A) Distance of hinge axis to residue i in
(A) Change in
(deg) Change in
(deg) Angle of psi(i) axis to hinge axis
(deg) Angle of psi(i) axis to hinge axis
(deg) Percentage Progress
PRO-332
PRO-333
7.1
7.1
-0.1
1.3
112.6
117.3
61.2
PRO-333
GLU-334
10.3
10.2
3.3
4.9
13.4
12.3
35.4
GLU-334
ARG-335
9.4
9.1
-0.4
22.5
103.4
99.4
153.1
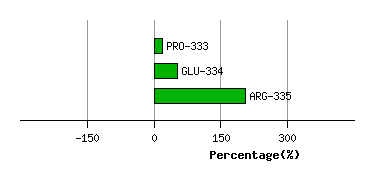
Graph shows rotational transition at bending residues and can be used
to identify hinge bending residues.
Probably only informative for interdomain rotations greater than 20 degrees