Shikimate Kinase
(All numbering and residues are taken from first PDB file)
![]()
![]()
Bending Residue Dihedral Analysis
Residue
iResidue
i+1Distance of hinge axis to residue i in
(A) Distance of hinge axis to residue i in
(A) Change in
(deg) Change in
(deg) Angle of psi(i) axis to hinge axis
(deg) Angle of psi(i) axis to hinge axis
(deg) Percentage Progress
LEU-30
LEU-31
7.5
7.4
6.5
-5.0
100.3
102.1
15.1
LEU-31
ASP-32
3.8
3.7
-0.7
3.5
120.3
120.1
34.0
ASP-32
THR-33
4.9
4.6
12.0
-6.5
89.8
88.9
-2.6
THR-33
ASP-34
4.1
4.1
1.1
0.2
59.6
59.0
17.4
THR-33
ASP-34
4.1
4.1
1.1
0.2
59.6
59.0
17.4

Graph shows rotational transition at bending residues and can be used
to identify hinge bending residues.
Probably only informative for interdomain rotations greater than 20 degrees
Residue
iResidue
i+1Distance of hinge axis to residue i in
(A) Distance of hinge axis to residue i in
(A) Change in
(deg) Change in
(deg) Angle of psi(i) axis to hinge axis
(deg) Angle of psi(i) axis to hinge axis
(deg) Percentage Progress
THR-33
ASP-34
4.1
4.1
1.1
0.2
59.6
59.0
17.4
THR-33
ASP-34
4.1
4.1
1.1
0.2
59.6
59.0
17.4
ASP-34
VAL-35
7.6
7.5
3.1
-6.6
15.4
18.9
-64.9
VAL-35
ALA-36
6.2
5.9
11.6
-10.4
81.2
82.7
39.2
ALA-36
ILE-37
3.8
3.8
18.0
-23.5
88.1
89.4
45.9
ILE-37
GLU-38
7.4
7.6
13.6
-13.9
26.1
28.5
-21.1

Graph shows rotational transition at bending residues and can be used
to identify hinge bending residues.
Probably only informative for interdomain rotations greater than 20 degrees
Residue
iResidue
i+1Distance of hinge axis to residue i in
(A) Distance of hinge axis to residue i in
(A) Change in
(deg) Change in
(deg) Angle of psi(i) axis to hinge axis
(deg) Angle of psi(i) axis to hinge axis
(deg) Percentage Progress
GLU-62
ASP-63
8.3
8.4
5.2
4.3
64.6
63.1
96.4
ASP-63
VAL-64
9.2
9.4
-4.8
0.4
120.8
119.6
-63.0
VAL-64
VAL-65
6.0
6.2
5.2
-7.6
129.6
127.5
34.1
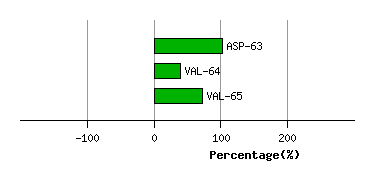
Graph shows rotational transition at bending residues and can be used
to identify hinge bending residues.
Probably only informative for interdomain rotations greater than 20 degrees
Residue
iResidue
i+1Distance of hinge axis to residue i in
(A) Distance of hinge axis to residue i in
(A) Change in
(deg) Change in
(deg) Angle of psi(i) axis to hinge axis
(deg) Angle of psi(i) axis to hinge axis
(deg) Percentage Progress
SER-77
LEU-78
6.2
6.2
1.0
-1.0
87.9
83.3
29.9
LEU-78
GLY-79
5.7
5.6
-23.0
12.6
78.3
81.6
22.5
GLY-79
GLY-80
8.8
8.6
-8.2
-2.1
150.0
152.9
-143.5
GLY-80
GLY-81
11.6
11.2
6.7
6.3
139.3
131.5
-144.4
GLY-80
GLY-81
11.6
11.2
6.7
6.3
139.3
131.5
-144.4

Graph shows rotational transition at bending residues and can be used
to identify hinge bending residues.
Probably only informative for interdomain rotations greater than 20 degrees
Residue
iResidue
i+1Distance of hinge axis to residue i in
(A) Distance of hinge axis to residue i in
(A) Change in
(deg) Change in
(deg) Angle of psi(i) axis to hinge axis
(deg) Angle of psi(i) axis to hinge axis
(deg) Percentage Progress
GLY-80
GLY-81
11.6
11.2
6.7
6.3
139.3
131.5
-144.4
GLY-80
GLY-81
11.6
11.2
6.7
6.3
139.3
131.5
-144.4
GLY-81
ALA-82
11.7
11.6
-15.6
3.0
81.2
77.5
17.9
ALA-82
VAL-83
8.4
8.3
-0.1
-4.9
13.4
12.7
86.8

Graph shows rotational transition at bending residues and can be used
to identify hinge bending residues.
Probably only informative for interdomain rotations greater than 20 degrees