6-Phosphogluconate Dehydrogenase, Decarboxylating
(All numbering and residues are taken from first PDB file)
![]()
![]()
Bending Residue Dihedral Analysis
Residue
iResidue
i+1Distance of hinge axis to residue i in
(A) Distance of hinge axis to residue i in
(A) Change in
(deg) Change in
(deg) Angle of psi(i) axis to hinge axis
(deg) Angle of psi(i) axis to hinge axis
(deg) Percentage Progress
GLY-101
ASN-102
7.8
7.7
-4.0
-6.0
69.9
78.6
8.8
ASN-102
THR-103
7.9
7.7
1.2
-3.5
175.9
176.9
20.7
THR-103
PHE-104
6.8
6.4
3.7
-1.5
119.5
119.1
22.4

Graph shows rotational transition at bending residues and can be used
to identify hinge bending residues.
Probably only informative for interdomain rotations greater than 20 degrees
Residue
iResidue
i+1Distance of hinge axis to residue i in
(A) Distance of hinge axis to residue i in
(A) Change in
(deg) Change in
(deg) Angle of psi(i) axis to hinge axis
(deg) Angle of psi(i) axis to hinge axis
(deg) Percentage Progress
ILE-109
ARG-110
1.9
2.2
1.0
2.0
51.2
48.0
12.6
ARG-110
ARG-111
3.5
3.4
-3.6
0.8
61.7
66.6
23.4
ARG-111
ASN-112
6.2
6.3
-0.3
-2.5
71.0
73.0
0.8

Graph shows rotational transition at bending residues and can be used
to identify hinge bending residues.
Probably only informative for interdomain rotations greater than 20 degrees
Residue
iResidue
i+1Distance of hinge axis to residue i in
(A) Distance of hinge axis to residue i in
(A) Change in
(deg) Change in
(deg) Angle of psi(i) axis to hinge axis
(deg) Angle of psi(i) axis to hinge axis
(deg) Percentage Progress
ILE-123
GLY-124
6.6
6.4
-7.0
6.3
85.5
91.4
-39.3
GLY-124
THR-125
3.2
3.1
9.2
-1.8
41.3
36.3
41.5
THR-125
GLY-126
1.5
1.5
-1.9
-5.3
105.1
106.3
0.0
GLY-126
VAL-127
2.7
2.6
-1.0
0.3
17.0
15.6
-3.1
GLY-126
VAL-127
2.7
2.6
-1.0
0.3
17.0
15.6
-3.1
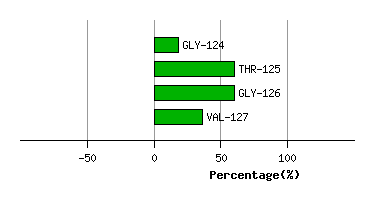
Graph shows rotational transition at bending residues and can be used
to identify hinge bending residues.
Probably only informative for interdomain rotations greater than 20 degrees
Residue
iResidue
i+1Distance of hinge axis to residue i in
(A) Distance of hinge axis to residue i in
(A) Change in
(deg) Change in
(deg) Angle of psi(i) axis to hinge axis
(deg) Angle of psi(i) axis to hinge axis
(deg) Percentage Progress
GLY-126
VAL-127
2.7
2.6
-1.0
0.3
17.0
15.6
-3.1
GLY-126
VAL-127
2.7
2.6
-1.0
0.3
17.0
15.6
-3.1
VAL-127
SER-128
4.0
3.9
-11.9
15.0
74.5
73.8
-10.2
SER-128
GLY-129
6.5
6.4
3.0
-9.6
171.0
167.7
48.7

Graph shows rotational transition at bending residues and can be used
to identify hinge bending residues.
Probably only informative for interdomain rotations greater than 20 degrees
Residue
iResidue
i+1Distance of hinge axis to residue i in
(A) Distance of hinge axis to residue i in
(A) Change in
(deg) Change in
(deg) Angle of psi(i) axis to hinge axis
(deg) Angle of psi(i) axis to hinge axis
(deg) Percentage Progress
LYS-136
GLY-137
6.1
6.3
-4.5
0.5
70.4
74.5
9.1
GLY-137
PRO-138
3.2
3.1
-9.6
5.7
49.7
47.5
29.3
PRO-138
SER-139
3.6
3.4
2.5
-12.0
107.9
106.0
11.3

Graph shows rotational transition at bending residues and can be used
to identify hinge bending residues.
Probably only informative for interdomain rotations greater than 20 degrees
Residue
iResidue
i+1Distance of hinge axis to residue i in
(A) Distance of hinge axis to residue i in
(A) Change in
(deg) Change in
(deg) Angle of psi(i) axis to hinge axis
(deg) Angle of psi(i) axis to hinge axis
(deg) Percentage Progress
GLY-144
GLN-145
7.2
7.5
16.4
-2.0
89.7
95.2
15.3
GLN-145
LYS-146
11.0
11.3
-16.6
-1.6
16.9
20.5
127.7
LYS-146
GLU-147
12.7
12.7
-3.8
1.1
67.4
61.3
41.2

Graph shows rotational transition at bending residues and can be used
to identify hinge bending residues.
Probably only informative for interdomain rotations greater than 20 degrees
Residue
iResidue
i+1Distance of hinge axis to residue i in
(A) Distance of hinge axis to residue i in
(A) Change in
(deg) Change in
(deg) Angle of psi(i) axis to hinge axis
(deg) Angle of psi(i) axis to hinge axis
(deg) Percentage Progress
VAL-152
ALA-153
11.1
12.1
-0.8
-0.1
132.9
132.3
7.6
ALA-153
PRO-154
10.1
10.6
12.6
-5.4
19.1
13.3
83.6
PRO-154
ILE-155
11.5
12.0
11.6
-4.7
74.6
74.6
23.5

Graph shows rotational transition at bending residues and can be used
to identify hinge bending residues.
Probably only informative for interdomain rotations greater than 20 degrees
Residue
iResidue
i+1Distance of hinge axis to residue i in
(A) Distance of hinge axis to residue i in
(A) Change in
(deg) Change in
(deg) Angle of psi(i) axis to hinge axis
(deg) Angle of psi(i) axis to hinge axis
(deg) Percentage Progress
LEU-156
THR-157
6.4
6.9
-4.0
1.3
38.7
42.2
33.1
THR-157
LYS-158
6.7
7.1
15.6
-27.1
143.5
150.5
50.7
LYS-158
ILE-159
7.2
7.0
13.6
1.4
92.5
89.1
-39.9
ILE-159
ALA-160
5.1
5.0
-0.5
-1.2
84.0
81.6
8.7
ILE-159
ALA-160
5.1
5.0
-0.5
-1.2
84.0
81.6
8.7

Graph shows rotational transition at bending residues and can be used
to identify hinge bending residues.
Probably only informative for interdomain rotations greater than 20 degrees
Residue
iResidue
i+1Distance of hinge axis to residue i in
(A) Distance of hinge axis to residue i in
(A) Change in
(deg) Change in
(deg) Angle of psi(i) axis to hinge axis
(deg) Angle of psi(i) axis to hinge axis
(deg) Percentage Progress
ILE-159
ALA-160
5.1
5.0
-0.5
-1.2
84.0
81.6
8.7
ILE-159
ALA-160
5.1
5.0
-0.5
-1.2
84.0
81.6
8.7
ALA-160
ALA-161
1.7
1.7
8.2
-10.4
31.6
33.3
-7.9
ALA-161
VAL-162
1.5
1.6
-4.4
13.7
101.6
103.9
73.8

Graph shows rotational transition at bending residues and can be used
to identify hinge bending residues.
Probably only informative for interdomain rotations greater than 20 degrees