Isoleucyl-Trna Synthetase
(All numbering and residues are taken from first PDB file)
![]()
![]()
Bending Residue Dihedral Analysis
Residue
iResidue
i+1Distance of hinge axis to residue i in
(A) Distance of hinge axis to residue i in
(A) Change in
(deg) Change in
(deg) Angle of psi(i) axis to hinge axis
(deg) Angle of psi(i) axis to hinge axis
(deg) Percentage Progress
VAL-183
TYR-184
11.8
11.8
15.9
-9.7
100.8
101.3
-45.6
TYR-184
TRP-185
8.1
8.1
-15.0
23.5
129.5
133.4
92.6
TRP-185
SER-186
6.6
6.9
-9.7
22.8
76.0
80.4
-5.4
SER-186
PRO-187
4.4
4.1
3.3
-7.4
117.7
111.4
25.7
SER-186
PRO-187
4.4
4.1
3.3
-7.4
117.7
111.4
25.7

Graph shows rotational transition at bending residues and can be used
to identify hinge bending residues.
Probably only informative for interdomain rotations greater than 20 degrees
Residue
iResidue
i+1Distance of hinge axis to residue i in
(A) Distance of hinge axis to residue i in
(A) Change in
(deg) Change in
(deg) Angle of psi(i) axis to hinge axis
(deg) Angle of psi(i) axis to hinge axis
(deg) Percentage Progress
SER-186
PRO-187
4.4
4.1
3.3
-7.4
117.7
111.4
25.7
SER-186
PRO-187
4.4
4.1
3.3
-7.4
117.7
111.4
25.7
PRO-187
SER-188
7.6
6.9
-1.8
11.6
59.4
55.7
-44.2
SER-188
SER-189
6.3
5.7
-81.1
82.7
31.0
17.6
44.7
SER-189
GLU-190
5.0
3.7
16.2
0.1
69.2
69.5
75.2
SER-189
GLU-190
5.0
3.7
16.2
0.1
69.2
69.5
75.2

Graph shows rotational transition at bending residues and can be used
to identify hinge bending residues.
Probably only informative for interdomain rotations greater than 20 degrees
Residue
iResidue
i+1Distance of hinge axis to residue i in
(A) Distance of hinge axis to residue i in
(A) Change in
(deg) Change in
(deg) Angle of psi(i) axis to hinge axis
(deg) Angle of psi(i) axis to hinge axis
(deg) Percentage Progress
SER-189
GLU-190
5.0
3.7
16.2
0.1
69.2
69.5
75.2
SER-189
GLU-190
5.0
3.7
16.2
0.1
69.2
69.5
75.2
GLU-190
SER-191
7.8
6.9
-28.9
28.6
120.7
113.9
-15.0
SER-191
SER-192
6.9
6.1
-7.0
7.5
43.8
41.2
-23.4
SER-192
LEU-193
7.4
7.4
-12.2
4.0
96.6
95.9
-66.4

Graph shows rotational transition at bending residues and can be used
to identify hinge bending residues.
Probably only informative for interdomain rotations greater than 20 degrees
Residue
iResidue
i+1Distance of hinge axis to residue i in
(A) Distance of hinge axis to residue i in
(A) Change in
(deg) Change in
(deg) Angle of psi(i) axis to hinge axis
(deg) Angle of psi(i) axis to hinge axis
(deg) Percentage Progress
HIS-201
ASP-202
6.4
6.7
-41.7
24.0
33.0
36.1
186.2
ASP-202
LYS-203
5.6
5.9
18.2
-15.7
78.1
78.6
23.1
LYS-203
ARG-204
3.6
4.0
4.7
2.6
160.6
149.9
-93.3

Graph shows rotational transition at bending residues and can be used
to identify hinge bending residues.
Probably only informative for interdomain rotations greater than 20 degrees
Residue
iResidue
i+1Distance of hinge axis to residue i in
(A) Distance of hinge axis to residue i in
(A) Change in
(deg) Change in
(deg) Angle of psi(i) axis to hinge axis
(deg) Angle of psi(i) axis to hinge axis
(deg) Percentage Progress
ALA-206
SER-207
5.9
6.7
17.4
-33.3
62.0
73.1
-118.1
SER-207
ILE-208
4.8
6.0
8.5
4.5
53.1
41.2
147.8
ILE-208
TYR-209
8.2
9.1
22.7
-6.0
68.8
70.9
161.1
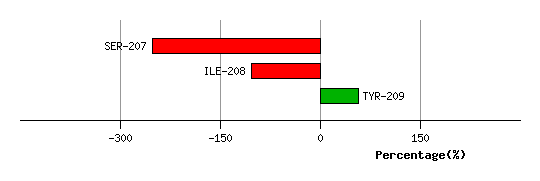
Graph shows rotational transition at bending residues and can be used
to identify hinge bending residues.
Probably only informative for interdomain rotations greater than 20 degrees
Residue
iResidue
i+1Distance of hinge axis to residue i in
(A) Distance of hinge axis to residue i in
(A) Change in
(deg) Change in
(deg) Angle of psi(i) axis to hinge axis
(deg) Angle of psi(i) axis to hinge axis
(deg) Percentage Progress
LYS-215
ASP-216
28.8
29.4
43.3
-11.4
61.9
71.1
129.6
ASP-216
ASP-217
32.3
32.5
91.0
-135.0
116.2
139.8
228.6
ASP-217
LYS-218
34.8
34.3
41.2
-8.6
81.0
74.9
81.2

Graph shows rotational transition at bending residues and can be used
to identify hinge bending residues.
Probably only informative for interdomain rotations greater than 20 degrees
Residue
iResidue
i+1Distance of hinge axis to residue i in
(A) Distance of hinge axis to residue i in
(A) Change in
(deg) Change in
(deg) Angle of psi(i) axis to hinge axis
(deg) Angle of psi(i) axis to hinge axis
(deg) Percentage Progress
ALA-225
LYS-226
23.7
23.7
-143.4
122.4
42.8
22.0
352.3
LYS-226
PHE-227
21.6
21.9
-9.0
10.8
60.8
71.0
101.2
PHE-227
ILE-228
19.5
20.0
-13.0
16.5
76.5
70.5
84.8

Graph shows rotational transition at bending residues and can be used
to identify hinge bending residues.
Probably only informative for interdomain rotations greater than 20 degrees
Residue
iResidue
i+1Distance of hinge axis to residue i in
(A) Distance of hinge axis to residue i in
(A) Change in
(deg) Change in
(deg) Angle of psi(i) axis to hinge axis
(deg) Angle of psi(i) axis to hinge axis
(deg) Percentage Progress
TRP-230
THR-231
10.8
11.0
-29.1
33.0
174.9
162.1
45.2
THR-231
THR-232
9.6
10.0
5.2
-8.8
83.8
82.7
-18.2
THR-232
THR-233
6.0
6.6
31.9
-32.8
48.6
33.2
-41.2
THR-233
PRO-234
7.6
8.8
-65.0
44.7
67.7
79.6
129.2
PRO-234
TRP-235
10.7
11.8
24.6
-16.2
56.0
42.9
5.9

Graph shows rotational transition at bending residues and can be used
to identify hinge bending residues.
Probably only informative for interdomain rotations greater than 20 degrees
Residue
iResidue
i+1Distance of hinge axis to residue i in
(A) Distance of hinge axis to residue i in
(A) Change in
(deg) Change in
(deg) Angle of psi(i) axis to hinge axis
(deg) Angle of psi(i) axis to hinge axis
(deg) Percentage Progress
ILE-237
PRO-238
15.7
15.9
23.7
-28.7
117.5
114.2
77.2
PRO-238
SER-239
18.2
18.8
43.8
-18.4
134.8
119.5
-243.0
SER-239
ASN-240
18.4
19.2
13.3
11.7
59.0
45.1
280.6
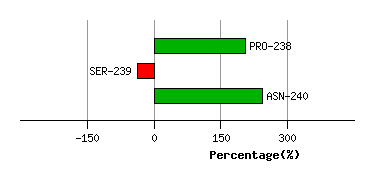
Graph shows rotational transition at bending residues and can be used
to identify hinge bending residues.
Probably only informative for interdomain rotations greater than 20 degrees
Residue
iResidue
i+1Distance of hinge axis to residue i in
(A) Distance of hinge axis to residue i in
(A) Change in
(deg) Change in
(deg) Angle of psi(i) axis to hinge axis
(deg) Angle of psi(i) axis to hinge axis
(deg) Percentage Progress
GLU-248
LEU-249
27.5
28.5
-52.9
95.7
48.3
46.9
-304.4
LEU-249
LYS-250
24.2
25.0
17.9
32.4
90.9
105.7
-80.6
LYS-250
TYR-251
22.5
24.7
-39.1
4.8
28.2
59.6
380.6
TYR-251
GLY-252
22.4
22.7
61.1
-82.0
83.5
73.5
-18.0
GLY-252
GLN-253
21.5
21.7
-47.1
35.7
33.9
45.7
138.2
GLN-253
TYR-254
19.7
19.8
35.5
-53.7
117.6
121.1
42.5
TYR-254
ASN-255
20.0
20.8
-44.9
57.3
37.4
29.9
-195.9
ASN-255
VAL-256
17.9
18.1
5.9
-42.2
103.2
108.7
219.7

Graph shows rotational transition at bending residues and can be used
to identify hinge bending residues.
Probably only informative for interdomain rotations greater than 20 degrees
Residue
iResidue
i+1Distance of hinge axis to residue i in
(A) Distance of hinge axis to residue i in
(A) Change in
(deg) Change in
(deg) Angle of psi(i) axis to hinge axis
(deg) Angle of psi(i) axis to hinge axis
(deg) Percentage Progress
GLY-258
GLU-259
17.8
17.6
0.2
-8.4
105.3
104.0
12.9
GLU-259
LYS-260
20.6
20.5
-3.3
-12.4
85.1
89.6
-37.3
LYS-260
TYR-261
19.6
19.9
-86.7
69.0
19.8
22.6
248.0

Graph shows rotational transition at bending residues and can be used
to identify hinge bending residues.
Probably only informative for interdomain rotations greater than 20 degrees
Residue
iResidue
i+1Distance of hinge axis to residue i in
(A) Distance of hinge axis to residue i in
(A) Change in
(deg) Change in
(deg) Angle of psi(i) axis to hinge axis
(deg) Angle of psi(i) axis to hinge axis
(deg) Percentage Progress
ILE-262
ILE-263
19.2
18.9
3.6
38.4
52.5
67.6
247.2
ILE-263
ALA-264
17.4
16.4
42.0
-58.2
94.3
71.4
15.0
ALA-264
GLU-265
18.2
18.0
25.9
-12.7
139.7
134.7
-101.4
GLU-265
ALA-266
18.3
19.1
-32.3
-26.7
108.3
93.7
-193.4
ALA-266
LEU-267
17.2
17.4
41.8
-5.1
94.3
75.3
29.2

Graph shows rotational transition at bending residues and can be used
to identify hinge bending residues.
Probably only informative for interdomain rotations greater than 20 degrees
Residue
iResidue
i+1Distance of hinge axis to residue i in
(A) Distance of hinge axis to residue i in
(A) Change in
(deg) Change in
(deg) Angle of psi(i) axis to hinge axis
(deg) Angle of psi(i) axis to hinge axis
(deg) Percentage Progress
LYS-286
GLU-287
25.3
25.1
2.6
10.1
25.4
20.2
152.8
GLU-287
TYR-288
24.3
24.1
0.7
-15.4
53.1
59.4
-126.9
TYR-288
THR-289
26.5
26.6
-98.7
130.7
127.0
150.5
324.2
THR-289
GLY-290
27.5
27.3
20.1
-11.2
20.3
28.9
131.4
GLY-290
LYS-291
25.7
25.0
-47.7
27.0
128.6
139.6
-243.1
LYS-291
GLU-292
28.4
27.4
-23.6
35.9
101.1
97.9
-168.3
GLU-292
LEU-293
30.9
30.2
31.3
-30.4
76.9
82.5
-123.6
LEU-293
GLU-294
28.5
28.2
78.4
-47.1
12.0
16.7
446.9
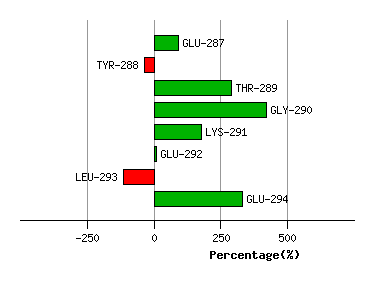
Graph shows rotational transition at bending residues and can be used
to identify hinge bending residues.
Probably only informative for interdomain rotations greater than 20 degrees
Residue
iResidue
i+1Distance of hinge axis to residue i in
(A) Distance of hinge axis to residue i in
(A) Change in
(deg) Change in
(deg) Angle of psi(i) axis to hinge axis
(deg) Angle of psi(i) axis to hinge axis
(deg) Percentage Progress
VAL-296
VAL-297
29.0
29.2
-131.5
122.6
56.8
71.4
96.4
VAL-297
ALA-298
28.2
29.7
-18.7
2.7
120.0
122.8
-146.7
ALA-298
GLN-299
25.9
27.2
-32.0
38.0
47.7
54.2
-34.1
GLN-299
HIS-300
25.5
27.0
-5.0
0.4
82.0
81.6
-36.7
GLN-299
HIS-300
25.5
27.0
-5.0
0.4
82.0
81.6
-36.7

Graph shows rotational transition at bending residues and can be used
to identify hinge bending residues.
Probably only informative for interdomain rotations greater than 20 degrees
Residue
iResidue
i+1Distance of hinge axis to residue i in
(A) Distance of hinge axis to residue i in
(A) Change in
(deg) Change in
(deg) Angle of psi(i) axis to hinge axis
(deg) Angle of psi(i) axis to hinge axis
(deg) Percentage Progress
GLN-299
HIS-300
25.5
27.0
-5.0
0.4
82.0
81.6
-36.7
GLN-299
HIS-300
25.5
27.0
-5.0
0.4
82.0
81.6
-36.7
HIS-300
PRO-301
22.2
23.6
-47.1
-6.0
104.8
103.1
-215.9
PRO-301
PHE-302
21.9
24.1
-19.5
41.0
152.7
139.9
247.7
PHE-302
LEU-303
21.7
22.4
40.2
-56.6
76.6
49.6
-153.5
LEU-303
ASP-304
25.3
25.7
35.1
-84.4
98.9
60.1
6.1
ASP-304
ARG-305
25.6
26.2
165.6
-88.4
66.8
75.3
297.8

Graph shows rotational transition at bending residues and can be used
to identify hinge bending residues.
Probably only informative for interdomain rotations greater than 20 degrees
Residue
iResidue
i+1Distance of hinge axis to residue i in
(A) Distance of hinge axis to residue i in
(A) Change in
(deg) Change in
(deg) Angle of psi(i) axis to hinge axis
(deg) Angle of psi(i) axis to hinge axis
(deg) Percentage Progress
VAL-309
ILE-310
26.7
26.7
-8.4
-24.4
105.3
100.6
-97.3
ILE-310
ASN-311
25.7
25.5
-34.1
27.5
58.1
77.9
33.9
ASN-311
GLY-312
26.1
26.8
-13.9
76.1
111.4
97.4
177.4

Graph shows rotational transition at bending residues and can be used
to identify hinge bending residues.
Probably only informative for interdomain rotations greater than 20 degrees
Residue
iResidue
i+1Distance of hinge axis to residue i in
(A) Distance of hinge axis to residue i in
(A) Change in
(deg) Change in
(deg) Angle of psi(i) axis to hinge axis
(deg) Angle of psi(i) axis to hinge axis
(deg) Percentage Progress
ALA-327
PRO-328
17.7
18.1
-17.4
16.6
147.6
151.8
10.5
PRO-328
GLY-329
18.8
18.7
-23.2
28.6
140.5
138.0
66.9
GLY-329
HIS-330
16.7
17.1
12.1
-12.8
86.8
86.5
7.8
HIS-330
GLY-331
13.2
13.6
3.5
8.8
122.1
119.5
-193.4

Graph shows rotational transition at bending residues and can be used
to identify hinge bending residues.
Probably only informative for interdomain rotations greater than 20 degrees
Residue
iResidue
i+1Distance of hinge axis to residue i in
(A) Distance of hinge axis to residue i in
(A) Change in
(deg) Change in
(deg) Angle of psi(i) axis to hinge axis
(deg) Angle of psi(i) axis to hinge axis
(deg) Percentage Progress
ILE-336
VAL-337
22.5
22.4
-9.3
-18.2
34.8
43.6
332.7
VAL-337
GLY-338
23.4
23.9
25.5
-42.9
89.8
93.5
24.8
GLY-338
GLN-339
23.5
23.1
159.7
-155.9
48.2
26.4
20.9

Graph shows rotational transition at bending residues and can be used
to identify hinge bending residues.
Probably only informative for interdomain rotations greater than 20 degrees
Residue
iResidue
i+1Distance of hinge axis to residue i in
(A) Distance of hinge axis to residue i in
(A) Change in
(deg) Change in
(deg) Angle of psi(i) axis to hinge axis
(deg) Angle of psi(i) axis to hinge axis
(deg) Percentage Progress
ASN-371
LYS-372
13.6
13.8
-43.0
27.3
158.4
147.0
-240.5
LYS-372
ALA-373
12.9
12.5
74.0
-91.0
52.6
63.7
-66.6
ALA-373
VAL-374
16.2
16.3
-25.0
-4.3
90.7
79.2
-33.3
VAL-374
THR-375
17.1
18.3
-15.0
-27.2
140.5
114.4
-408.8
THR-375
ASP-376
14.9
17.3
32.0
-20.8
36.7
11.7
207.3
ASP-376
LEU-377
16.7
16.1
107.6
-66.2
83.5
58.3
409.3
LEU-377
LEU-378
20.4
19.9
4.7
0.5
65.8
61.4
196.4
LEU-378
THR-379
20.4
19.9
108.4
-93.0
41.0
66.4
144.6
THR-379
GLU-380
17.5
17.2
-31.7
-13.0
145.9
162.9
-560.4
GLU-380
LYS-381
19.4
17.1
69.4
-8.3
102.7
73.7
65.1
LYS-381
GLY-382
22.8
20.8
-21.5
-39.0
58.1
96.5
187.1
GLY-382
ALA-383
22.4
21.7
6.1
92.3
48.2
90.7
500.3
ALA-383
LEU-384
21.2
18.8
-1.9
-15.3
113.8
120.7
-78.4
LEU-384
LEU-385
18.0
16.2
-46.9
22.7
72.4
58.2
205.1
LEU-385
LYS-386
14.6
13.2
-46.7
9.7
113.3
112.8
-220.0
LYS-386
LEU-387
10.7
10.0
-45.7
72.6
42.8
32.5
-274.5
LEU-387
ASP-388
8.4
9.9
-43.9
12.9
99.5
97.3
-42.2

Graph shows rotational transition at bending residues and can be used
to identify hinge bending residues.
Probably only informative for interdomain rotations greater than 20 degrees
Residue
iResidue
i+1Distance of hinge axis to residue i in
(A) Distance of hinge axis to residue i in
(A) Change in
(deg) Change in
(deg) Angle of psi(i) axis to hinge axis
(deg) Angle of psi(i) axis to hinge axis
(deg) Percentage Progress
PHE-389
ILE-390
4.9
6.0
-35.2
45.3
85.4
94.8
-9.9
ILE-390
THR-391
3.2
2.9
-25.3
5.5
18.5
24.6
280.6
THR-391
HIS-392
4.0
3.8
-6.9
-38.6
77.3
82.3
211.8

Graph shows rotational transition at bending residues and can be used
to identify hinge bending residues.
Probably only informative for interdomain rotations greater than 20 degrees
Residue
iResidue
i+1Distance of hinge axis to residue i in
(A) Distance of hinge axis to residue i in
(A) Change in
(deg) Change in
(deg) Angle of psi(i) axis to hinge axis
(deg) Angle of psi(i) axis to hinge axis
(deg) Percentage Progress
TYR-394
PRO-395
2.8
3.2
7.3
7.6
20.9
9.4
176.8
PRO-395
HIS-396
3.6
3.9
-28.5
13.2
117.3
121.0
-101.1
HIS-396
ASP-397
2.2
2.5
-3.0
25.2
158.9
165.2
305.9

Graph shows rotational transition at bending residues and can be used
to identify hinge bending residues.
Probably only informative for interdomain rotations greater than 20 degrees
Residue
iResidue
i+1Distance of hinge axis to residue i in
(A) Distance of hinge axis to residue i in
(A) Change in
(deg) Change in
(deg) Angle of psi(i) axis to hinge axis
(deg) Angle of psi(i) axis to hinge axis
(deg) Percentage Progress
ARG-399
THR-400
6.4
6.1
-10.6
32.8
102.8
109.6
127.1
THR-400
LYS-401
5.6
5.6
21.0
-7.2
17.2
17.0
224.3
LYS-401
LYS-402
5.8
6.1
11.7
-17.2
50.8
55.3
-75.2

Graph shows rotational transition at bending residues and can be used
to identify hinge bending residues.
Probably only informative for interdomain rotations greater than 20 degrees