Alcohol Dehydrogenase 1
(All numbering and residues are taken from first PDB file)
![]()
![]()
Bending Residue Dihedral Analysis
Residue
iResidue
i+1Distance of hinge axis to residue i in
(A) Distance of hinge axis to residue i in
(A) Change in
(deg) Change in
(deg) Angle of psi(i) axis to hinge axis
(deg) Angle of psi(i) axis to hinge axis
(deg) Percentage Progress
GLY-155
ILE-156
5.6
5.6
21.4
-17.7
29.1
35.2
83.2
ILE-156
THR-157
3.4
3.3
1.8
-1.2
45.0
37.6
-26.2
THR-157
VAL-158
6.6
6.2
11.4
-8.5
88.7
91.7
-24.6

Graph shows rotational transition at bending residues and can be used
to identify hinge bending residues.
Probably only informative for interdomain rotations greater than 20 degrees
Residue
iResidue
i+1Distance of hinge axis to residue i in
(A) Distance of hinge axis to residue i in
(A) Change in
(deg) Change in
(deg) Angle of psi(i) axis to hinge axis
(deg) Angle of psi(i) axis to hinge axis
(deg) Percentage Progress
TYR-294
VAL-295
7.5
7.2
95.1
-98.0
45.6
42.4
-37.7
VAL-295
GLY-296
6.5
5.8
-97.6
100.7
91.7
83.7
6.0
GLY-296
ASN-297
2.9
2.1
0.4
-3.1
99.9
109.3
39.1

Graph shows rotational transition at bending residues and can be used
to identify hinge bending residues.
Probably only informative for interdomain rotations greater than 20 degrees
Residue
iResidue
i+1Distance of hinge axis to residue i in
(A) Distance of hinge axis to residue i in
(A) Change in
(deg) Change in
(deg) Angle of psi(i) axis to hinge axis
(deg) Angle of psi(i) axis to hinge axis
(deg) Percentage Progress
ALA-299
ASP-300
5.5
6.0
-7.1
-3.1
57.7
56.0
88.3
ASP-300
THR-301
2.0
2.6
3.6
-4.4
151.0
147.9
-6.4
THR-301
ARG-302
2.9
2.9
14.6
-10.0
131.0
132.4
-29.5
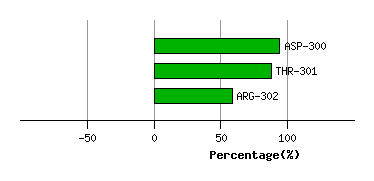
Graph shows rotational transition at bending residues and can be used
to identify hinge bending residues.
Probably only informative for interdomain rotations greater than 20 degrees
Residue
iResidue
i+1Distance of hinge axis to residue i in
(A) Distance of hinge axis to residue i in
(A) Change in
(deg) Change in
(deg) Angle of psi(i) axis to hinge axis
(deg) Angle of psi(i) axis to hinge axis
(deg) Percentage Progress
GLU-303
ALA-304
4.9
5.5
-4.4
1.2
126.2
127.6
-20.2
ALA-304
LEU-305
2.1
2.6
7.0
-5.4
20.8
24.5
36.3
LEU-305
ASP-306
1.9
2.4
-6.9
9.5
122.9
124.5
-16.7

Graph shows rotational transition at bending residues and can be used
to identify hinge bending residues.
Probably only informative for interdomain rotations greater than 20 degrees
Residue
iResidue
i+1Distance of hinge axis to residue i in
(A) Distance of hinge axis to residue i in
(A) Change in
(deg) Change in
(deg) Angle of psi(i) axis to hinge axis
(deg) Angle of psi(i) axis to hinge axis
(deg) Percentage Progress
ARG-310
GLY-311
6.8
7.0
6.1
-4.0
127.5
128.1
0.9
GLY-311
LEU-312
5.5
5.1
-5.6
7.8
109.7
110.3
-23.4
LEU-312
VAL-313
8.0
7.5
13.2
-2.0
70.5
72.0
72.5
VAL-313
LYS-314
7.0
6.1
-30.8
12.8
56.5
54.2
50.1
LYS-314
SER-315
6.6
6.6
-26.7
-5.1
99.3
95.4
-99.1
SER-315
PRO-316
9.0
9.3
10.3
4.5
146.4
143.6
-80.6
PRO-316
ILE-317
12.0
11.5
27.3
-9.0
83.5
71.5
70.5
ILE-317
LYS-318
12.5
12.1
15.2
-27.7
142.1
135.9
90.8
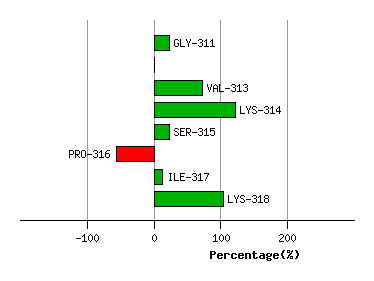
Graph shows rotational transition at bending residues and can be used
to identify hinge bending residues.
Probably only informative for interdomain rotations greater than 20 degrees