Putative Enzyme Ydif
(All numbering and residues are taken from first PDB file)
![]()
![]()
Bending Residue Dihedral Analysis
Residue
iResidue
i+1Distance of hinge axis to residue i in
(A) Distance of hinge axis to residue i in
(A) Change in
(deg) Change in
(deg) Angle of psi(i) axis to hinge axis
(deg) Angle of psi(i) axis to hinge axis
(deg) Percentage Progress
LEU-275
ASP-276
18.1
18.0
-0.3
3.6
106.5
110.3
16.1
PRO-284
LEU-285
21.7
21.8
25.9
4.5
138.8
128.7
-529.3
LEU-285
ASN-286
20.2
20.2
-21.8
27.2
20.0
22.4
-2.7
ASN-286
GLN-287
20.0
20.2
3.2
3.7
117.0
121.1
13.7
GLN-287
ARG-288
17.4
17.8
-18.4
14.3
110.0
114.6
31.1
ARG-288
LYS-289
15.8
15.9
-1.9
-1.3
144.2
136.8
-26.7
LYS-289
LEU-290
15.3
15.4
8.5
-12.9
108.2
110.3
69.2
LEU-290
VAL-291
14.4
14.6
4.6
-4.7
105.5
105.0
23.0
VAL-291
ALA-292
11.4
11.5
1.8
-2.7
37.9
39.6
-126.3
ALA-292
ARG-293
10.4
10.4
3.6
0.5
59.9
61.0
79.6
ARG-293
ARG-294
10.6
10.6
6.0
-6.5
117.2
117.1
-6.3
ARG-294
ALA-295
8.9
9.0
-0.4
3.0
93.8
94.0
119.7
ALA-295
LEU-296
5.9
6.0
-5.4
6.4
153.0
151.5
-60.4
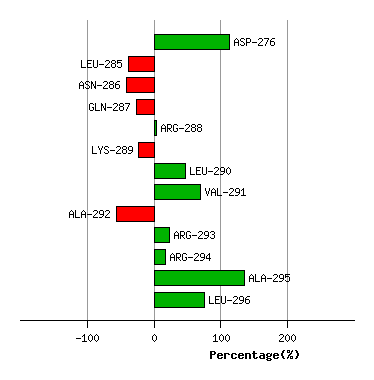
Graph shows rotational transition at bending residues and can be used
to identify hinge bending residues.
Probably only informative for interdomain rotations greater than 20 degrees
Residue
iResidue
i+1Distance of hinge axis to residue i in
(A) Distance of hinge axis to residue i in
(A) Change in
(deg) Change in
(deg) Angle of psi(i) axis to hinge axis
(deg) Angle of psi(i) axis to hinge axis
(deg) Percentage Progress
ARG-300
LYS-301
3.5
3.7
-9.6
-1.9
32.8
25.1
351.7
LYS-301
GLY-302
3.6
4.0
-6.7
6.6
94.5
89.5
-86.4
GLY-302
ALA-303
5.2
5.2
5.2
4.4
31.7
37.3
283.1
ALA-303
VAL-304
5.2
5.0
-8.4
5.3
85.6
81.4
-16.2
VAL-304
GLY-305
7.3
7.5
0.1
-11.7
28.4
26.5
-319.6
GLY-305
ASN-306
6.9
6.9
-14.3
-20.5
92.8
98.5
-134.4
ASN-306
VAL-307
9.7
9.3
-1.1
-58.3
88.8
121.7
-549.1
VAL-307
GLY-308
11.2
9.9
-6.0
5.5
161.4
115.5
-177.4
GLY-308
VAL-309
11.6
12.5
15.1
36.6
82.3
89.7
122.8
VAL-309
GLY-310
15.0
15.3
22.5
24.2
45.6
43.0
973.2
GLY-310
ILE-311
15.3
14.9
-13.1
8.2
69.3
69.1
147.8
ILE-311
ALA-312
13.8
14.0
-13.2
-24.4
47.2
36.4
786.4
ALA-312
ASP-313
10.9
11.3
26.6
-12.3
157.4
143.9
-294.3
ASP-313
GLY-314
13.2
12.9
15.4
-11.5
133.6
149.7
-211.4
GLY-314
ILE-315
13.1
13.5
13.4
-0.1
118.5
115.3
-274.7
ILE-315
GLY-316
9.4
9.8
10.9
-4.6
174.3
167.9
-128.7
GLY-316
LEU-317
10.0
10.0
7.2
-9.3
119.0
123.1
15.0
LEU-317
VAL-318
12.8
12.7
5.6
0.4
89.0
86.8
-46.9
VAL-318
ALA-319
11.5
11.6
-0.8
-2.9
49.9
52.9
27.3
ALA-319
ARG-320
8.3
8.4
6.1
-5.7
158.1
162.4
-28.0
ARG-320
GLU-321
10.5
10.3
3.1
1.0
100.4
100.0
-32.2
GLU-321
GLU-322
13.0
12.9
-1.6
2.9
83.3
83.2
-19.5

Graph shows rotational transition at bending residues and can be used
to identify hinge bending residues.
Probably only informative for interdomain rotations greater than 20 degrees
Residue
iResidue
i+1Distance of hinge axis to residue i in
(A) Distance of hinge axis to residue i in
(A) Change in
(deg) Change in
(deg) Angle of psi(i) axis to hinge axis
(deg) Angle of psi(i) axis to hinge axis
(deg) Percentage Progress
ILE-329
LEU-330
6.6
6.7
-3.7
5.0
25.1
26.9
-14.0
LEU-330
THR-331
8.7
8.7
0.1
-6.3
83.5
84.7
-17.1
THR-331
VAL-332
12.1
12.1
12.4
-26.2
132.3
137.8
265.3
VAL-332
GLU-333
15.0
14.9
2.5
-11.0
117.2
109.3
-126.3
GLU-333
THR-334
16.7
17.0
11.2
0.1
71.8
71.9
80.1
THR-334
GLY-335
20.2
20.3
-1.7
-1.7
152.0
158.4
-60.6
GLY-335
PRO-336
19.4
19.5
0.5
-3.0
39.3
42.1
-48.8
PRO-336
ILE-337
17.5
17.4
-10.5
14.0
83.1
87.6
-57.0
ILE-337
GLY-338
14.0
14.1
-4.6
3.4
130.1
127.0
13.3

Graph shows rotational transition at bending residues and can be used
to identify hinge bending residues.
Probably only informative for interdomain rotations greater than 20 degrees
Residue
iResidue
i+1Distance of hinge axis to residue i in
(A) Distance of hinge axis to residue i in
(A) Change in
(deg) Change in
(deg) Angle of psi(i) axis to hinge axis
(deg) Angle of psi(i) axis to hinge axis
(deg) Percentage Progress
VAL-373
CYS-374
4.8
5.0
9.5
-11.6
105.0
97.8
329.3
CYS-374
TYR-375
6.5
6.3
23.1
-7.2
114.5
121.1
-371.5
TYR-375
LEU-376
6.7
6.6
-11.6
13.7
58.0
61.0
-148.7
LEU-376
SER-377
9.1
9.0
-3.9
-2.2
125.9
129.3
-137.1
LEU-376
SER-377
9.1
9.0
-3.9
-2.2
125.9
129.3
-137.1

Graph shows rotational transition at bending residues and can be used
to identify hinge bending residues.
Probably only informative for interdomain rotations greater than 20 degrees
Residue
iResidue
i+1Distance of hinge axis to residue i in
(A) Distance of hinge axis to residue i in
(A) Change in
(deg) Change in
(deg) Angle of psi(i) axis to hinge axis
(deg) Angle of psi(i) axis to hinge axis
(deg) Percentage Progress
LEU-376
SER-377
9.1
9.0
-3.9
-2.2
125.9
129.3
-137.1
LEU-376
SER-377
9.1
9.0
-3.9
-2.2
125.9
129.3
-137.1
SER-377
PHE-378
10.8
10.9
-14.9
17.5
157.0
154.7
185.0
PHE-378
ALA-379
10.5
10.6
12.6
-9.6
59.0
58.8
93.6

Graph shows rotational transition at bending residues and can be used
to identify hinge bending residues.
Probably only informative for interdomain rotations greater than 20 degrees
Residue
iResidue
i+1Distance of hinge axis to residue i in
(A) Distance of hinge axis to residue i in
(A) Change in
(deg) Change in
(deg) Angle of psi(i) axis to hinge axis
(deg) Angle of psi(i) axis to hinge axis
(deg) Percentage Progress
ILE-413
PHE-414
2.8
2.7
-0.1
-1.9
68.9
64.8
37.3
PHE-414
CYS-415
5.3
5.2
-1.2
0.0
100.0
97.5
28.1
CYS-415
GLY-416
8.0
8.0
-2.7
8.1
57.0
57.4
-100.8
GLY-416
THR-417
11.1
11.0
28.7
-30.2
111.1
109.9
57.5
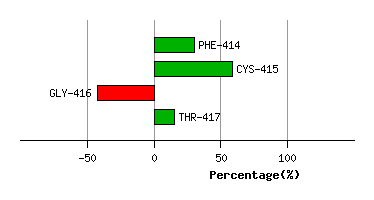
Graph shows rotational transition at bending residues and can be used
to identify hinge bending residues.
Probably only informative for interdomain rotations greater than 20 degrees
Residue
iResidue
i+1Distance of hinge axis to residue i in
(A) Distance of hinge axis to residue i in
(A) Change in
(deg) Change in
(deg) Angle of psi(i) axis to hinge axis
(deg) Angle of psi(i) axis to hinge axis
(deg) Percentage Progress
PHE-443
ILE-444
8.2
8.2
12.1
-10.1
5.4
6.6
113.6
ILE-444
ARG-445
8.0
7.8
-10.5
20.0
110.0
114.6
-44.4
ARG-445
GLU-446
5.3
5.3
-2.7
-8.8
81.1
74.7
4.7

Graph shows rotational transition at bending residues and can be used
to identify hinge bending residues.
Probably only informative for interdomain rotations greater than 20 degrees
Residue
iResidue
i+1Distance of hinge axis to residue i in
(A) Distance of hinge axis to residue i in
(A) Change in
(deg) Change in
(deg) Angle of psi(i) axis to hinge axis
(deg) Angle of psi(i) axis to hinge axis
(deg) Percentage Progress
VAL-464
ARG-465
3.1
3.2
4.5
-6.8
94.0
96.7
53.8
ARG-465
TYR-466
1.2
1.2
-5.6
3.5
66.1
69.6
-63.1
TYR-466
ILE-467
3.7
3.7
8.3
-6.2
69.1
71.1
46.2
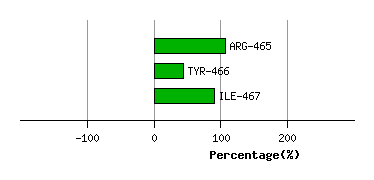
Graph shows rotational transition at bending residues and can be used
to identify hinge bending residues.
Probably only informative for interdomain rotations greater than 20 degrees
Residue
iResidue
i+1Distance of hinge axis to residue i in
(A) Distance of hinge axis to residue i in
(A) Change in
(deg) Change in
(deg) Angle of psi(i) axis to hinge axis
(deg) Angle of psi(i) axis to hinge axis
(deg) Percentage Progress
ARG-515
LEU-516
17.6
17.6
-3.2
-5.0
104.9
103.1
-59.7
LEU-516
PHE-517
15.6
15.7
3.2
0.3
76.2
76.7
19.5
PHE-517
ILE-518
19.0
19.1
-4.4
8.1
48.9
47.8
-49.6
ILE-518
ASP-519
20.9
21.0
5.5
-1.9
129.7
126.9
28.8
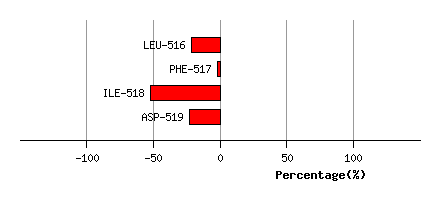
Graph shows rotational transition at bending residues and can be used
to identify hinge bending residues.
Probably only informative for interdomain rotations greater than 20 degrees