V-Type Atp Synthase Subunit F
(All numbering and residues are taken from first PDB file)
![]()
![]()
Bending Residue Dihedral Analysis
Residue
iResidue
i+1Distance of hinge axis to residue i in
(A) Distance of hinge axis to residue i in
(A) Change in
(deg) Change in
(deg) Angle of psi(i) axis to hinge axis
(deg) Angle of psi(i) axis to hinge axis
(deg) Percentage Progress
VAL-2
PRO-3
5.2
4.1
-23.6
23.7
124.8
130.5
141.1
PRO-3
VAL-4
2.3
2.2
-23.9
32.4
157.3
166.5
298.1
VAL-4
ARG-5
3.3
3.2
2.8
13.4
68.5
64.3
-13.1
ARG-5
MET-6
1.0
0.8
-0.5
-6.1
151.6
149.9
-128.5
MET-6
ALA-7
3.7
3.5
-1.2
4.4
118.8
117.8
24.1

Graph shows rotational transition at bending residues and can be used
to identify hinge bending residues.
Probably only informative for interdomain rotations greater than 20 degrees
Residue
iResidue
i+1Distance of hinge axis to residue i in
(A) Distance of hinge axis to residue i in
(A) Change in
(deg) Change in
(deg) Angle of psi(i) axis to hinge axis
(deg) Angle of psi(i) axis to hinge axis
(deg) Percentage Progress
GLU-39
THR-40
5.2
4.7
24.4
-30.0
40.1
48.9
-29.4
THR-40
LEU-41
7.9
7.4
-5.4
14.2
156.7
153.7
41.4
LEU-41
VAL-42
5.4
5.1
11.3
10.6
77.3
81.3
178.1

Graph shows rotational transition at bending residues and can be used
to identify hinge bending residues.
Probably only informative for interdomain rotations greater than 20 degrees
Residue
iResidue
i+1Distance of hinge axis to residue i in
(A) Distance of hinge axis to residue i in
(A) Change in
(deg) Change in
(deg) Angle of psi(i) axis to hinge axis
(deg) Angle of psi(i) axis to hinge axis
(deg) Percentage Progress
GLY-45
GLY-46
7.1
7.4
-15.5
-16.4
40.6
42.3
291.4
GLY-46
TYR-47
4.9
5.4
41.5
-26.3
85.7
91.4
37.7
TYR-47
ALA-48
1.5
1.8
7.8
-4.6
84.3
84.7
-69.0

Graph shows rotational transition at bending residues and can be used
to identify hinge bending residues.
Probably only informative for interdomain rotations greater than 20 degrees
Residue
iResidue
i+1Distance of hinge axis to residue i in
(A) Distance of hinge axis to residue i in
(A) Change in
(deg) Change in
(deg) Angle of psi(i) axis to hinge axis
(deg) Angle of psi(i) axis to hinge axis
(deg) Percentage Progress
GLU-65
ARG-66
8.0
7.9
-10.3
-25.8
66.8
82.0
38.6
ARG-66
LEU-67
5.4
5.4
11.4
15.3
44.4
41.3
321.3
LEU-67
MET-68
5.7
5.5
-5.0
-26.3
104.1
94.9
-177.6
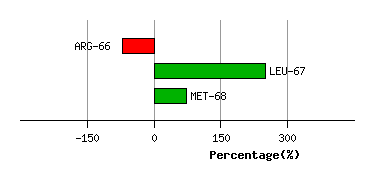
Graph shows rotational transition at bending residues and can be used
to identify hinge bending residues.
Probably only informative for interdomain rotations greater than 20 degrees