Mta/sah Nucleosidase
(All numbering and residues are taken from first PDB file)
![]()
![]()
Bending Residue Dihedral Analysis
Residue
iResidue
i+1Distance of hinge axis to residue i in
(A) Distance of hinge axis to residue i in
(A) Change in
(deg) Change in
(deg) Angle of psi(i) axis to hinge axis
(deg) Angle of psi(i) axis to hinge axis
(deg) Percentage Progress
VAL-43
ALA-44
14.1
14.2
-1.6
1.0
172.7
177.6
-25.7
ALA-44
LEU-45
12.7
12.8
-3.2
2.8
86.2
90.3
24.8
LEU-45
LEU-46
13.1
13.0
-17.7
30.9
151.9
160.4
139.3
LEU-46
LYS-47
12.1
11.6
-10.3
-12.4
80.3
89.3
-11.2

Graph shows rotational transition at bending residues and can be used
to identify hinge bending residues.
Probably only informative for interdomain rotations greater than 20 degrees
Residue
iResidue
i+1Distance of hinge axis to residue i in
(A) Distance of hinge axis to residue i in
(A) Change in
(deg) Change in
(deg) Angle of psi(i) axis to hinge axis
(deg) Angle of psi(i) axis to hinge axis
(deg) Percentage Progress
GLY-58
ALA-59
6.5
6.2
-6.8
5.2
136.2
133.6
-23.9
ALA-59
THR-60
4.1
3.7
-1.0
-1.6
70.1
65.8
16.8
THR-60
LEU-61
2.1
2.0
0.5
-1.7
105.9
105.7
-2.1

Graph shows rotational transition at bending residues and can be used
to identify hinge bending residues.
Probably only informative for interdomain rotations greater than 20 degrees
Residue
iResidue
i+1Distance of hinge axis to residue i in
(A) Distance of hinge axis to residue i in
(A) Change in
(deg) Change in
(deg) Angle of psi(i) axis to hinge axis
(deg) Angle of psi(i) axis to hinge axis
(deg) Percentage Progress
ASP-69
VAL-70
8.5
8.3
-3.6
1.8
72.2
73.5
15.0
VAL-70
ILE-71
5.4
5.1
2.4
0.2
57.5
56.3
70.9
ILE-71
ILE-72
4.5
4.5
3.5
0.0
130.2
126.4
-54.4

Graph shows rotational transition at bending residues and can be used
to identify hinge bending residues.
Probably only informative for interdomain rotations greater than 20 degrees
Residue
iResidue
i+1Distance of hinge axis to residue i in
(A) Distance of hinge axis to residue i in
(A) Change in
(deg) Change in
(deg) Angle of psi(i) axis to hinge axis
(deg) Angle of psi(i) axis to hinge axis
(deg) Percentage Progress
LEU-125
ILE-126
2.4
2.5
-1.4
-3.9
112.6
115.4
-56.1
ILE-126
ALA-127
4.0
4.1
3.3
1.5
27.4
23.6
67.1
ALA-127
ALA-128
3.5
3.4
1.1
7.9
92.0
90.8
6.0
ALA-128
ALA-129
5.7
5.6
-11.7
7.7
70.4
82.2
34.8
ALA-129
GLU-130
7.8
7.8
4.9
-7.2
44.9
38.1
-46.9
GLU-130
ALA-131
8.7
8.3
5.5
6.7
45.2
47.8
102.0
ALA-131
CYS-132
9.0
8.5
-4.8
3.3
70.2
76.3
16.6
CYS-132
ILE-133
11.6
11.6
-8.4
13.6
87.9
103.5
40.3
ILE-133
ALA-134
13.3
12.9
-2.4
-0.2
154.3
163.2
-37.9
ALA-134
GLU-135
13.7
12.7
-9.6
1.3
106.8
100.8
-73.8
GLU-135
LEU-136
14.9
14.3
-7.0
-1.6
67.6
69.4
-5.9

Graph shows rotational transition at bending residues and can be used
to identify hinge bending residues.
Probably only informative for interdomain rotations greater than 20 degrees
Residue
iResidue
i+1Distance of hinge axis to residue i in
(A) Distance of hinge axis to residue i in
(A) Change in
(deg) Change in
(deg) Angle of psi(i) axis to hinge axis
(deg) Angle of psi(i) axis to hinge axis
(deg) Percentage Progress
ASN-139
ALA-140
17.0
18.4
22.0
-56.1
133.9
142.8
314.4
ALA-140
VAL-141
13.9
15.8
31.3
-14.0
80.3
80.6
54.9
VAL-141
ARG-142
14.3
14.9
20.0
-21.6
127.3
124.6
-64.7
ARG-142
GLY-143
11.8
12.0
-2.3
-7.4
67.4
73.0
38.0
GLY-143
LEU-144
13.3
13.0
12.9
4.3
12.9
6.8
228.4
GLY-143
LEU-144
13.3
13.0
12.9
4.3
12.9
6.8
228.4

Graph shows rotational transition at bending residues and can be used
to identify hinge bending residues.
Probably only informative for interdomain rotations greater than 20 degrees
Residue
iResidue
i+1Distance of hinge axis to residue i in
(A) Distance of hinge axis to residue i in
(A) Change in
(deg) Change in
(deg) Angle of psi(i) axis to hinge axis
(deg) Angle of psi(i) axis to hinge axis
(deg) Percentage Progress
GLY-143
LEU-144
13.3
13.0
12.9
4.3
12.9
6.8
228.4
GLY-143
LEU-144
13.3
13.0
12.9
4.3
12.9
6.8
228.4
LEU-144
ILE-145
14.2
14.0
-3.2
2.4
128.3
125.0
-55.1
ILE-145
VAL-146
14.1
13.9
-2.8
8.8
148.0
151.9
60.0
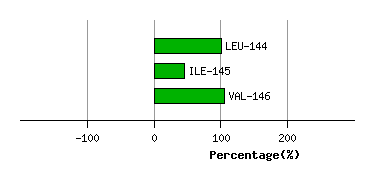
Graph shows rotational transition at bending residues and can be used
to identify hinge bending residues.
Probably only informative for interdomain rotations greater than 20 degrees
Residue
iResidue
i+1Distance of hinge axis to residue i in
(A) Distance of hinge axis to residue i in
(A) Change in
(deg) Change in
(deg) Angle of psi(i) axis to hinge axis
(deg) Angle of psi(i) axis to hinge axis
(deg) Percentage Progress
ARG-193
ALA-194
14.3
14.2
32.9
-33.4
51.7
51.7
9.3
ALA-194
ILE-195
17.7
17.8
9.9
11.4
109.2
115.5
-100.7
ILE-195
SER-196
20.2
20.5
16.1
-31.7
105.4
115.6
188.6
SER-196
ASP-197
23.1
23.2
16.1
-13.6
82.8
97.6
19.9
ASP-197
VAL-198
25.2
25.1
12.4
5.7
68.8
66.1
138.1
VAL-198
ALA-199
25.7
25.5
-103.9
80.6
62.6
43.9
138.5
ALA-199
ASP-200
27.2
25.5
89.6
9.7
77.8
95.8
-88.2
ASP-200
GLN-201
30.4
29.2
148.6
95.7
52.8
138.3
170.5
SER-206
PHE-207
31.9
29.3
168.6
-3.1
117.0
107.3
1131.1
PHE-207
ASP-208
29.6
26.2
14.3
-1.7
71.0
109.1
23.3
ASP-208
GLU-209
29.8
28.6
9.8
-34.1
16.9
47.2
-288.0
GLU-209
PHE-210
29.7
30.3
-1.3
-23.3
98.2
131.7
-193.5
PHE-210
LEU-211
26.3
27.3
75.5
0.5
118.7
109.0
-397.1
LEU-211
ALA-212
24.8
24.5
1.6
6.9
75.5
65.0
135.5
ALA-212
VAL-213
26.5
25.5
-6.2
6.6
145.5
158.0
40.7
VAL-213
ALA-214
25.0
24.9
16.3
-6.4
94.3
88.7
78.3
ALA-214
ALA-215
21.5
21.6
-0.2
3.9
63.1
75.4
27.8
ALA-215
LYS-216
20.8
20.8
0.7
5.4
58.0
41.9
83.5
LYS-216
GLN-217
22.2
22.2
-4.4
-2.5
136.9
132.3
-72.1
GLN-217
SER-218
20.1
19.8
-4.5
-1.3
72.3
72.4
45.2
SER-218
SER-219
17.0
16.7
-3.3
2.1
78.2
85.1
7.7

Graph shows rotational transition at bending residues and can be used
to identify hinge bending residues.
Probably only informative for interdomain rotations greater than 20 degrees