Adp-Ribosylation Factor 6
(All numbering and residues are taken from first PDB file)
![]()
![]()
Bending Residue Dihedral Analysis
Residue
iResidue
i+1Distance of hinge axis to residue i in
(A) Distance of hinge axis to residue i in
(A) Change in
(deg) Change in
(deg) Angle of psi(i) axis to hinge axis
(deg) Angle of psi(i) axis to hinge axis
(deg) Percentage Progress
THR-28
ILE-29
6.5
5.9
-5.0
9.1
127.6
136.3
4.7
ILE-29
LEU-30
5.9
5.6
0.9
7.7
73.1
85.3
-3.3
LEU-30
TYR-31
2.2
2.2
-6.0
-25.9
130.7
130.4
-17.6
TYR-31
LYS-32
3.1
1.9
17.2
-0.5
22.5
25.6
14.0

Graph shows rotational transition at bending residues and can be used
to identify hinge bending residues.
Probably only informative for interdomain rotations greater than 20 degrees
Residue
iResidue
i+1Distance of hinge axis to residue i in
(A) Distance of hinge axis to residue i in
(A) Change in
(deg) Change in
(deg) Angle of psi(i) axis to hinge axis
(deg) Angle of psi(i) axis to hinge axis
(deg) Percentage Progress
PHE-47
ASN-48
1.0
2.7
59.9
-20.8
141.0
141.1
-11.7
ASN-48
VAL-49
2.1
3.2
31.3
-32.6
132.3
120.9
5.8
VAL-49
GLU-50
3.9
5.9
-2.7
-32.0
32.1
24.5
26.9
GLU-50
THR-51
4.1
6.1
9.8
18.3
116.9
117.0
-9.2
THR-51
VAL-52
7.2
8.6
-2.9
-0.7
19.7
25.3
-1.1
VAL-52
THR-53
7.3
7.3
0.0
-10.0
66.0
53.7
-10.4
THR-53
TYR-54
10.4
9.5
-26.2
-14.2
14.5
39.2
32.6
TYR-54
LYS-55
10.4
9.6
17.3
14.4
108.1
103.2
-15.3
LYS-55
ASN-56
14.0
12.6
164.4
154.3
41.8
72.0
-32.2
ASN-56
VAL-57
16.2
14.6
8.7
-25.0
56.0
18.3
-20.4
VAL-57
LYS-58
13.4
14.4
-0.6
33.3
136.5
123.4
32.4
LYS-58
PHE-59
11.8
13.0
-26.4
23.5
115.4
145.8
-3.0
PHE-59
ASN-60
9.0
11.2
-12.1
13.7
149.8
133.4
18.6
ASN-60
VAL-61
7.9
10.8
-46.0
35.4
96.8
125.8
-15.4
VAL-61
TRP-62
5.1
7.8
-14.0
56.0
149.5
144.4
39.1
TRP-62
ASP-63
4.1
6.8
-40.5
-22.1
100.2
105.0
-10.9
ASP-63
VAL-64
5.8
3.8
-23.1
-19.9
139.2
166.5
-35.2
VAL-64
GLY-65
8.6
4.2
-49.7
-134.1
119.1
107.0
77.6
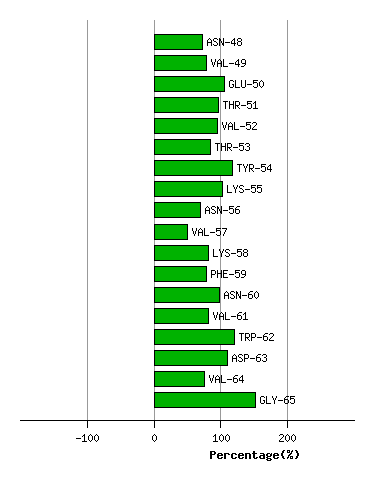
Graph shows rotational transition at bending residues and can be used
to identify hinge bending residues.
Probably only informative for interdomain rotations greater than 20 degrees