Glutamate Receptor Subunit 2
(All numbering and residues are taken from first PDB file)
![]()
![]()
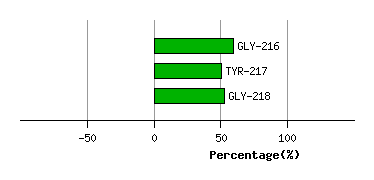
Bending Residue Dihedral Analysis
Residue
iResidue
i+1Distance of hinge axis to residue i in
(A) Distance of hinge axis to residue i in
(A) Change in
(deg) Change in
(deg) Angle of psi(i) axis to hinge axis
(deg) Angle of psi(i) axis to hinge axis
(deg) Percentage Progress
LYS-104
PRO-105
5.7
5.6
1.4
-4.9
132.2
133.0
29.7
PRO-105
PHE-106
3.2
3.2
-1.0
-1.0
40.8
37.4
32.0
PHE-106
MET-107
3.2
3.0
-0.7
-0.6
35.6
36.1
22.6

Graph shows rotational transition at bending residues and can be used
to identify hinge bending residues.
Probably only informative for interdomain rotations greater than 20 degrees
Residue
iResidue
i+1Distance of hinge axis to residue i in
(A) Distance of hinge axis to residue i in
(A) Change in
(deg) Change in
(deg) Angle of psi(i) axis to hinge axis
(deg) Angle of psi(i) axis to hinge axis
(deg) Percentage Progress
LYS-215
GLY-216
8.3
8.4
-7.6
16.1
112.9
114.4
50.5
GLY-216
TYR-217
4.5
4.7
-4.3
5.3
59.4
60.0
-8.8
TYR-217
GLY-218
2.3
2.4
1.8
0.6
115.3
116.7
2.6
Graph shows rotational transition at bending residues and can be used
to identify hinge bending residues.
Probably only informative for interdomain rotations greater than 20 degrees
Residue
iResidue
i+1Distance of hinge axis to residue i in
(A) Distance of hinge axis to residue i in
(A) Change in
(deg) Change in
(deg) Angle of psi(i) axis to hinge axis
(deg) Angle of psi(i) axis to hinge axis
(deg) Percentage Progress
PRO-226
TYR-227
10.9
10.9
-1.2
-0.4
11.3
7.6
34.3
TYR-227
ARG-228
10.6
10.6
-2.2
3.4
54.3
56.9
-7.3
ARG-228
ASP-229
7.6
7.5
-3.8
3.0
58.3
60.7
5.6
ASP-229
LYS-230
10.3
10.2
-9.0
7.6
50.3
48.2
9.7

Graph shows rotational transition at bending residues and can be used
to identify hinge bending residues.
Probably only informative for interdomain rotations greater than 20 degrees
Residue
iResidue
i+1Distance of hinge axis to residue i in
(A) Distance of hinge axis to residue i in
(A) Change in
(deg) Change in
(deg) Angle of psi(i) axis to hinge axis
(deg) Angle of psi(i) axis to hinge axis
(deg) Percentage Progress
LYS-243
LEU-244
10.4
10.4
-3.0
3.3
76.5
78.1
8.4
LEU-244
HIS-245
6.9
6.8
-4.0
5.4
146.6
148.3
28.0
HIS-245
MET-246
5.7
5.7
-4.3
2.6
124.1
122.8
-16.3
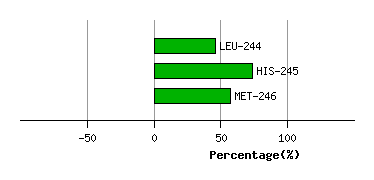
Graph shows rotational transition at bending residues and can be used
to identify hinge bending residues.
Probably only informative for interdomain rotations greater than 20 degrees
Residue
iResidue
i+1Distance of hinge axis to residue i in
(A) Distance of hinge axis to residue i in
(A) Change in
(deg) Change in
(deg) Angle of psi(i) axis to hinge axis
(deg) Angle of psi(i) axis to hinge axis
(deg) Percentage Progress
GLU-249
LYS-250
5.1
5.1
6.4
-3.1
95.9
96.4
-46.8
LYS-250
TRP-251
8.8
8.8
2.4
-2.6
75.4
75.2
-19.3
TRP-251
TRP-252
9.1
9.1
0.3
3.9
110.2
110.9
-20.1

Graph shows rotational transition at bending residues and can be used
to identify hinge bending residues.
Probably only informative for interdomain rotations greater than 20 degrees